How Sharesight helped me improve alignment with my readers
Disclaimer: This article is for informational purposes only and does not constitute a specific product recommendation, or taxation or financial advice, and should not be relied upon as such. While we use reasonable endeavours to keep the information up to date, we make no representation that any information is accurate or current. The views expressed in this article are those of the author and do not necessarily reflect the views of Sharesight. If you choose to make use of the content in this article, you do so at your own risk. To the extent permitted by law, we do not assume any responsibility or liability arising from or connected with your use or reliance on the content on our site. Please consult your adviser or accountant to obtain the correct advice for your situation.
When it comes to investing, some of the simplest insights are the hardest to implement. Case in point is the way businesses often struggle to align their incentives with their customers. And yet, look no further than legendary investor Charlie Munger to understand the power of incentives: "Show me the incentive,” he said, “and I will show you the outcome".
Some examples of misaligned incentives are well known in the finance industry. For example:
- Commissions can incentivise advisers to recommend high-commission products, instead of the best products.
- Management fees can incentivise managed funds to optimise for growing funds under management, rather than achieving high performance.
- An IPO, capital raising, or potential large block trade can incentivise broker analysts to give favourable ratings to a business.
The problem
As a stock picker, I confronted a lesser-known misalignment of incentives when it comes to reporting how my stock picks performed.
You see, the traditional way for a stock picking service to report on their stock picks is to present some sort of scorecard which shows the performance of each pick since it was made. The integrity of these scorecards vary widely between organisations.
Even organisations that properly report on all their picks and use a buy price that their readers could have actually achieved (for example, the next closing price after the recommendation), having a simple scorecard is still a flawed approach.
You see, when you make a stock pick, locking in a buy price, and then sell it, locking in a sell price, you permanently set in stone that return. If that return was a bad one, then it will permanently bring down the average return, and the scorecard will not benefit from the fact that readers would have released capital that could then be allocated into the best ideas available.
A simple scorecard fails to differentiate between losing 20%, selling, and redeploying into a stock that goes up 25% (bringing you back to even), all within a year, and simply holding on to stock that is down 20% in a year.
For this reason, taking a simple average of stock pick returns creates an incentive for the organisation to never sell, as long as they think that the stock will perform at or slightly above the market average. If you are thinking about optimising a scorecard, then you are incentivised not to sell. This incentive can be seen in play at organisations that have scores or even more than 100 active buy or hold recommendations.
While clients would clearly be better invested in the 20 stocks you rate best, over the top 100, a scorecard approach to reporting returns incentivises leaving a stock on ‘hold’ forever.
On top of that the approach limits an adviser to giving simple buy/hold/sell recommendations. And yet, that is not what I generally want to recommend. In the course of making official recommendations for A Rich Life, I have made multiple partial sell recommendations, with a view to recycling capital into new ideas.
The solution
For me, Sharesight provided a solution to better measure the value of my official recommendations at A Rich Life. I first entered all the buy recommendations into Sharesight, assuming that the hypothetical reader bought $10,000 worth of each recommendation at the next closing price after the recommendation was issued. Then, I added in a sell transaction at the next closing price after my sell recommendations were issued, whether a full or partial sale.
I use Sharesight to monitor my trailing 12 month returns, every six months.

I use Sharesight’s money weighted compound methodology to get an idea of how my stock picks are performing against a real-life benchmark. I prefer the SPDR S&P/ASX 200 ETF (ASX: STW), because I think an ASX 200 index fund is a sensible low-fee alternative to investing in individual stocks. Note that the ASX 200 index fund tends to outperform the ASX Small Ordinaries, which is an easier-to-beat benchmark preferred by many small-cap fund managers in order to maximise performance fees.
I also use Sharesight to assess the long term performance of my stock picks. You can see below that the performance in FY 2025 is a lot better than in some prior years. Initially, my recommendations lagged behind the market for a variety of reasons, including a bear market for small-cap growth stocks and a few unforced errors I made.

Sharesight does allow you to enter brokerage costs, but I excluded these from the calculations because each person would have their own brokerage costs. For my real-life portfolio, the brokerage is automatically entered thanks to Sharesight’s linkage with my broker.
At the end of the day, one resounding recommendation I have made more times than I care to count is that investors keep track of their own investing using Sharesight, and set the buy price in their actual online brokerage to zero.
It is very unhelpful to constantly anchor to your purchase price, which is shown by default in most online brokerages. It is a well-known fact that anchoring is a cognitive bias, and there is no doubt that constantly seeing your average purchase price just creates another number to anchor on.
Therefore, my strong recommendation is for all readers to set the purchase price on your online brokerage to zero, and use Sharesight to monitor and analyse your returns at regular intervals. I favour every six months for a performance analysis, but depending on your style you might need to monitor the performance of your portfolio at a different frequency.
And if you are not using it already, you can save on your Sharesight subscription via this link.
About the author
Claude Walker covers ASX growth stocks in writing at A Rich Life and on the ASX Small Cap Wrap podcast.
FURTHER READING

Sharesight users' top trades – December 2025
Welcome to the December 2025 edition of Sharesight’s monthly trading snapshot, where we look at the top buy and sell trades by Sharesight users over the month.

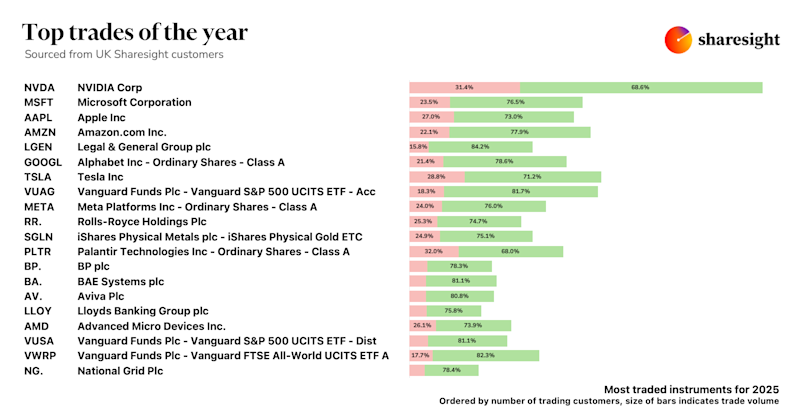
Top trades by UK Sharesight users in 2025
Welcome to the 2025 edition of our UK trading snapshot, where dive into this year’s top trades by the Sharesight userbase.

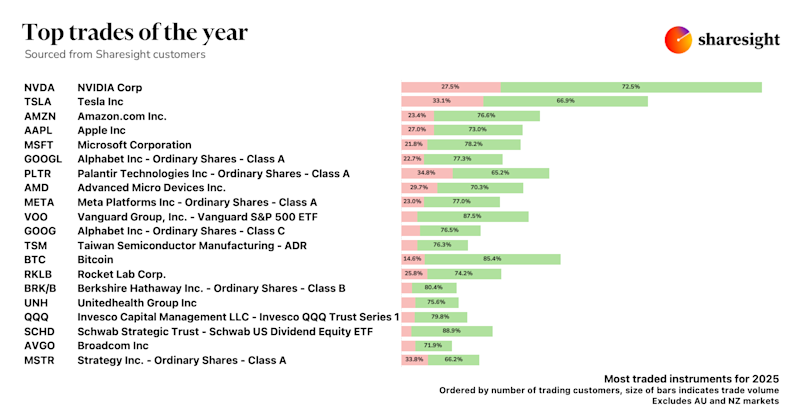
Top trades by global Sharesight users in 2025
Welcome to the 2025 edition of our global trading snapshot, where we dive into this year’s top trades by Sharesight users around the world.