Watch your investment grow
We’ve added a new graph option to the portfolio overview page that lets you visualise the value of your portfolio over time. You can switch between this and the portfolio gains graph by clicking the ‘change’ link to the top right of the graph. As with the other selection criteria, Sharesight will remember your graph choice next time you login, so you will always see your preferred graph right away.

Thanks to all of you who have been providing us with feedback. We have some more great features on the way soon, please keep the feedback coming!

Sharesight users' top trades – December 2025
Welcome to the December 2025 edition of Sharesight’s monthly trading snapshot, where we look at the top buy and sell trades by Sharesight users over the month.

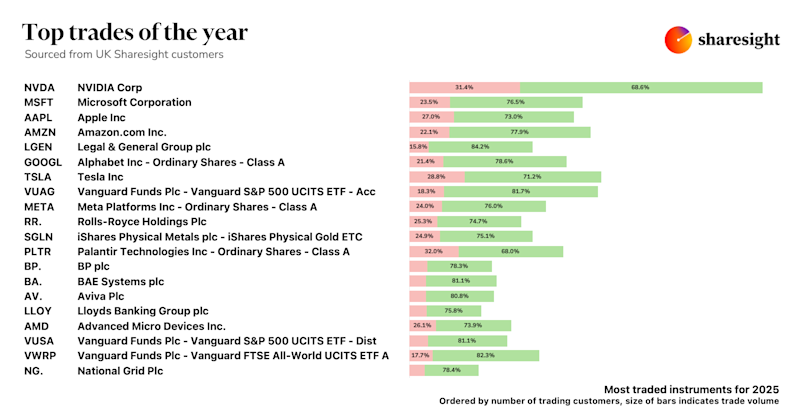
Top trades by UK Sharesight users in 2025
Welcome to the 2025 edition of our UK trading snapshot, where dive into this year’s top trades by the Sharesight userbase.

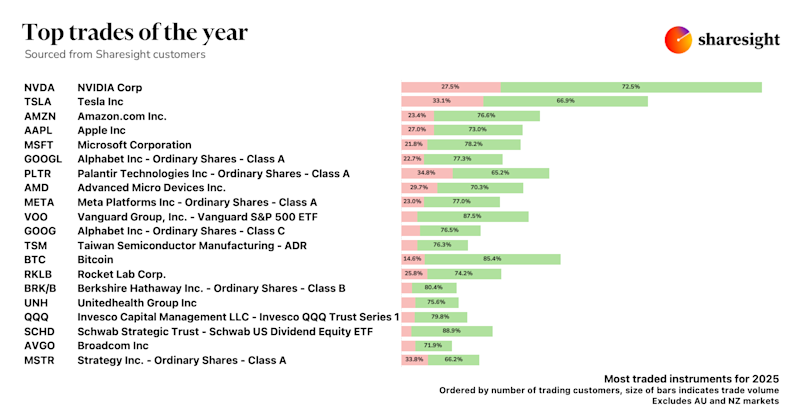
Top trades by global Sharesight users in 2025
Welcome to the 2025 edition of our global trading snapshot, where we dive into this year’s top trades by Sharesight users around the world.