The X-Ray tool for ETF investors
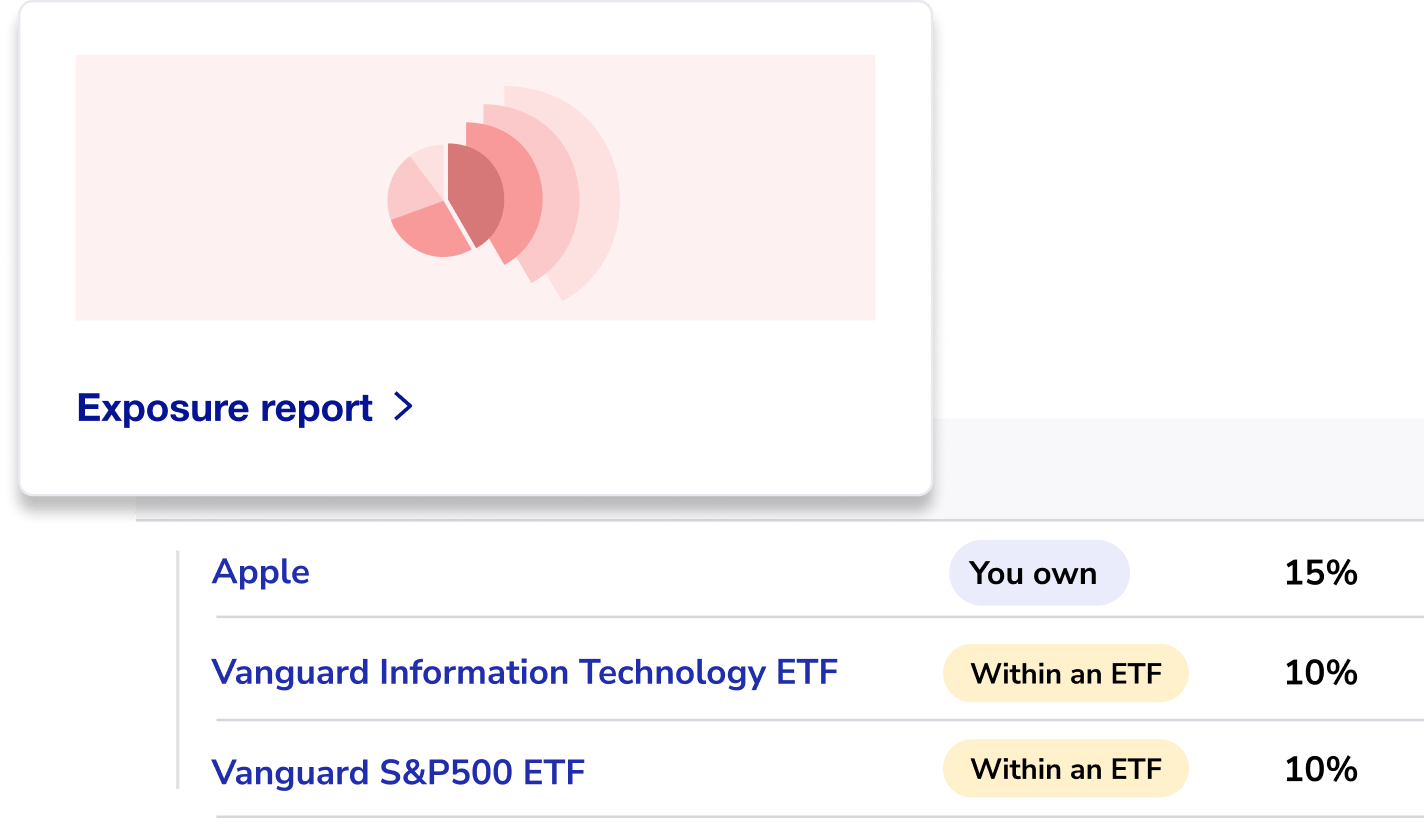
See inside your ETFs and avoid overlap in your portfolio with Sharesight's exposure report - The ultimate X-ray tool for ETF investors.
Sign up for free

Track your ETFs, stocks and more
Get automatically updated price and performance data on 700,000+ global stocks, ETFs, crypto and much more.
See your ETF distribution income
Calculate your annualised return including capital gains, dividends, distributions and currency fluctuations.
Benchmark against ETFs
Compare against a world of investments – benchmark against stocks, ETFs or funds.
See inside your ETFs
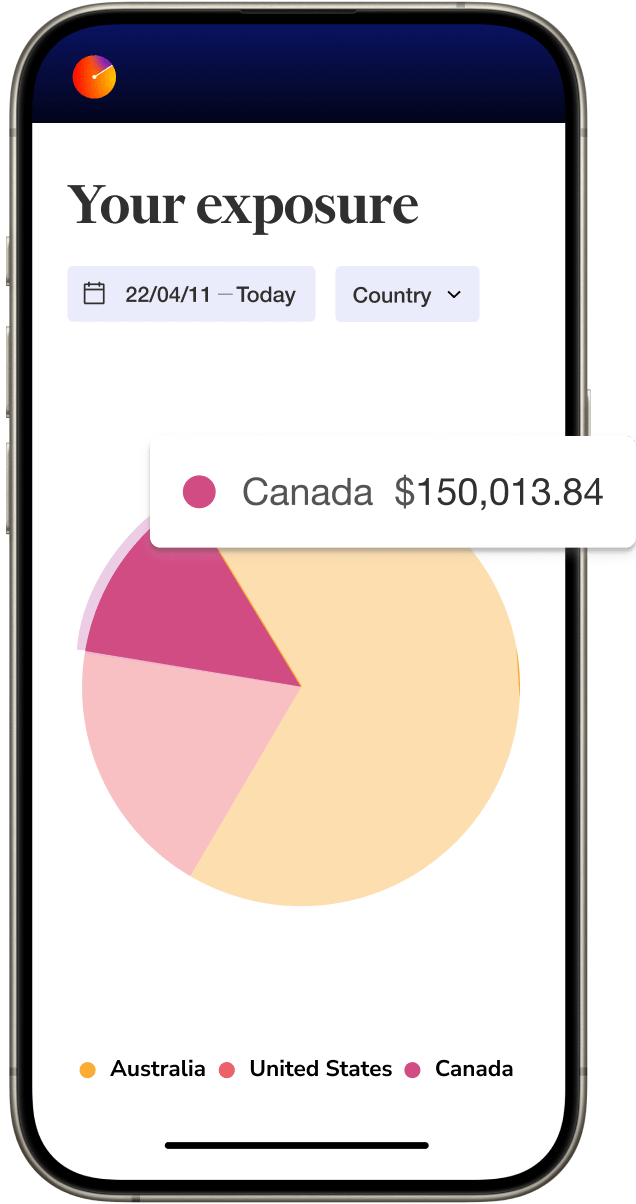
Know what you’re actually invested in and eliminate overlap in your portfolio. Sharesight’s exposure report shows the combination of shares, bonds and securities inside your ETFs.
We work with all your favourite brokers and apps
Sharesight integrates with hundreds of brokers and finance apps, including Questrade, CIBC Investors Edge and RBC Direct.
View our partners


Plans & Pricing
Start by tracking up to 10 holdings for free! Then upgrade to a premium plan at any time to track additional holdings or portfolios, and unlock advanced features.
Free
$0
Forever
Starter
$9
CAD per month
billed annually
$12 CAD billed monthly
Investor
$23.25
CAD per month
billed annually
$31 CAD billed monthly
Expert
$29.25
CAD per month
billed annually
$39 CAD billed monthly
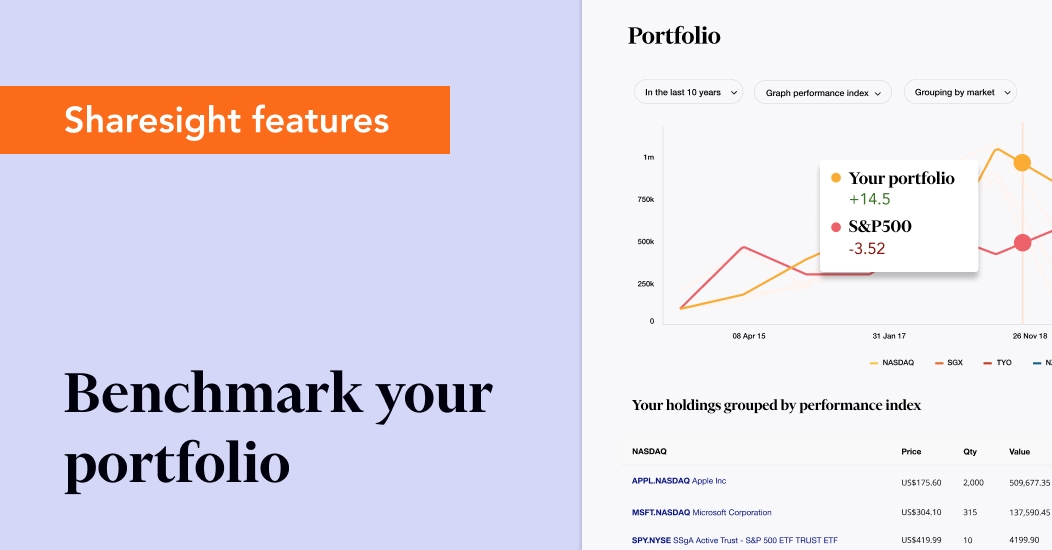
Benchmark your portfolio against any stock, ETF or fund
Investors using Sharesight can benchmark their portfolios against any stock, ETF, mutual/managed fund or unit trust that Sharesight currently supports.
ETFs vs. stocks
Stocks and ETFs can both be a valuable addition to an investor’s portfolio, however it’s important to understand the pros and cons of these two asset types.
How to track exchange-traded funds (ETFs)
Like all investments, it’s critical to track the performance of and distributions earned by exchange-traded funds (ETFs) in your portfolio.