Custom groupings, display options, more chart improvements
We recently released improvements to our charting package, and hinted at more improvements to come regarding analytics and display options. Today, we released three additional features: custom groupings, the ability to display your returns in dollars or percentage throughout the application, and even more improvements to charting.
Custom Groups
Many of you asked for options around how to display your portfolio holdings. Previously, our (locked) default was by market participation. Now you have a choice between: Market, Industry Classification (GICs), Investment Type, Country, or a Do Not Group option.

This setting can be found in the Advanced Options menu, which is new. We've added a link to this menu on the Portfolio Overview page and on all of the Reports pages. Once you've made your selection, click "Apply", and your grouping of choice will be carried throughout the application - from the home page to the reports. This setting will also change the groupings of the charts. We think these five options are a good start, but expect more in this area later in 2014.

Performance Display Options
While we've always allowed you to display figures in dollars or percentage, this was limited to certain parts of the application and didn't carry through the entire product. And it required a refreshing or reloading of any page where you made a change. We've greatly improved this by adding a "$/%" toggle button in the heading of every data table on Sharesight. Plus, we do the calculations for both settings behind the scenes, which means there's no delay when you switch back and forth.

Further Charting Improvements
We've also made two minor improvements to charting on the Portfolio Overview page which will save you time. We've moved the chart type drop-down menu to the left side of the page so it's grouped with the other display option settings. And we've eliminated the "Go" button. Now when you make a change to any setting the change will be applied immediately. Less clicks = better experience!

FURTHER READING
- Blog -- Announcing Custom Groups
- Blog -- Asset Allocation in Sharesight
- Blog -- Announcing the Contribution Analysis Report

Sharesight product updates – February 2026
This month's key focus was on the rollout of the new Investments tab to all users, along with various enhancements across web and mobile.

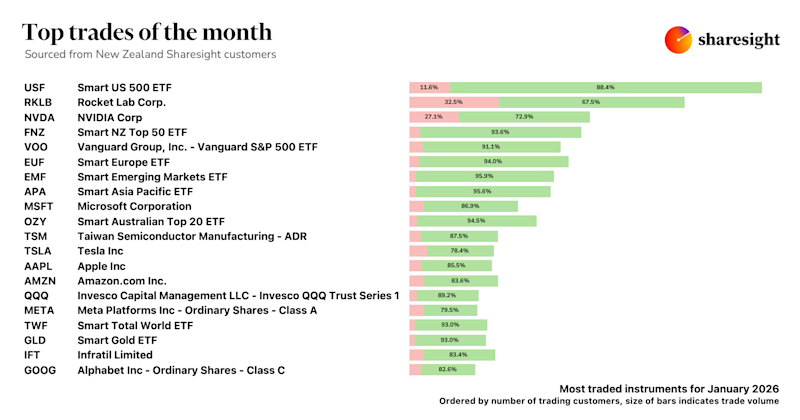
Top trades by New Zealand Sharesight users — January 2026
Welcome to the January 2026 edition of our trading snapshot for New Zealand investors, where we look at the top 20 trades made by New Zealand Sharesight users.

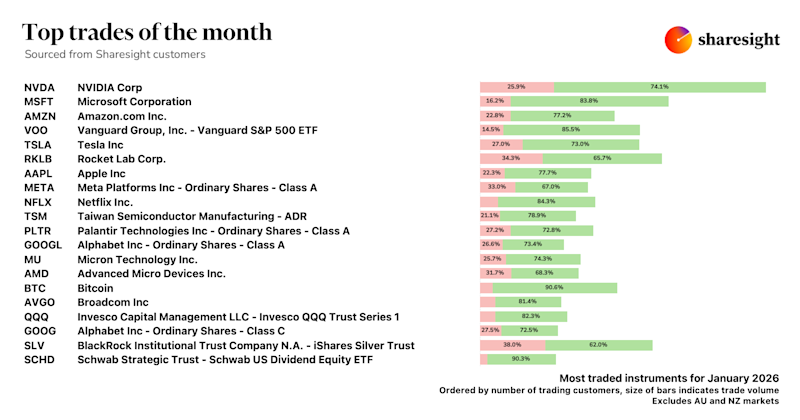
Top trades by global Sharesight users — January 2026
Welcome to the January 2026 edition of Sharesight’s trading snapshot for global investors, where we look at the top 20 trades made by Sharesight users globally.