Cate Blanchett, queen of 100% investment returns?
Cate Blanchett is a terrific actor. She’s won two Academy Awards and has starred in everything from The Lord of the Rings to The Aviator.
But did you know she’s also a shrewd property investor who doesn’t settle for anything less than a 100% return? Who needs acting (or stocks) when you can flip houses?
In late 2016, it was widely reported that Blanchett sold her Sydney house for $19.8M. She bought the house for $10M in 2005. Ok, technically that’s a 98% return, but still, the press was agog over her incredible return. Clickbait to be sure (I took a look at the photos -- it’s a stunning house).

Clearly, Blanchett predicted the Australian housing boom and envisioned the post financial crisis interest rate environment, right? Maybe Blanchett really is an astute property investor, or maybe she got some great advice. Maybe she just wanted to live in a movie star worthy house on Sydney Harbour.
But in any case, it’s human nature to look at these numbers and think, “Wow! Cate Blanchett just pocketed $9.8M. Where else could you make that kind of return?”
The answer is usually nowhere. And Cate Blanchett didn’t pocket $10M in cash either.
There are three hugely important factors missing from the above calculation.
-
How long did Blanchett own the house?
-
How much money did she spend upgrading and maintaining the property?
-
What were her transaction costs when buying and selling?
She owned the house for 11 years, so while her total return is 98%, on an annualised basis that’s actually a return of 8.16%. Historically 8% is about the return an investor could expect from the stock market.
| Total Return | 98% | | Real Return | 8.16% |
Annualisation is critical because it puts investment performance in the same terms as everything else in our financial life. You get paid an annual salary. Schools quote tuition annually. Budgets are done yearly. Human beings think in one year blocks because it helps us estimate opportunity cost and it’s how we make real life comparisons.
Unfortunately, annualising (like compounding) is impossible for people to do in their heads, but it’s worth spending the time and energy to figure it out.
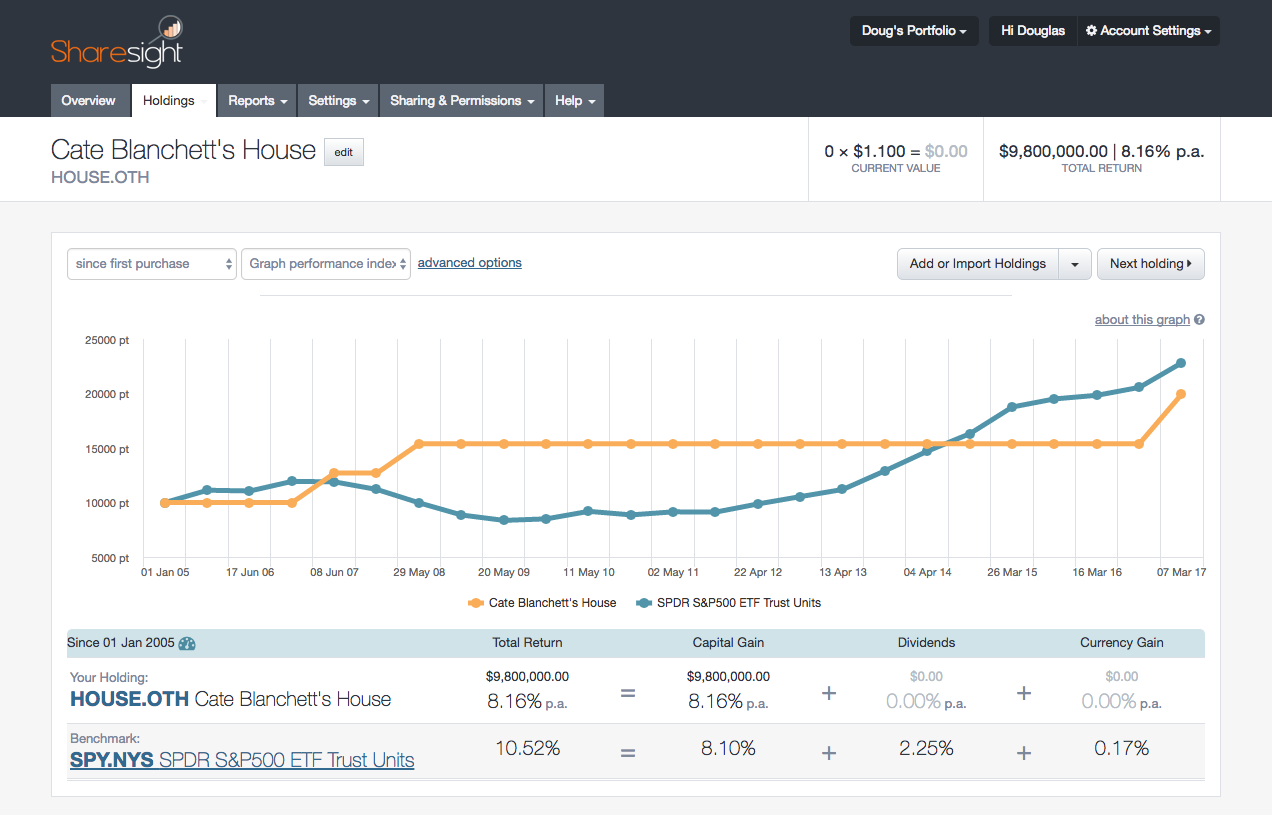
So what would Cate’s money have done in the stock market? To find out, I added Cate’s house to a Sharesight portfolio and compared it to an ETF that tracks the S&P 500 (SPY).

Cate would have been better off investing her $10M in the stock market.
Including dividends and currency effects, the difference between 8.16% and 10.52% annualised over 11 years is a whopping $6.8M!
| Total Annualized Return | Total Gain | |
|---|---|---|
| Cate’s House | 8.16% | $9,800,000 |
| S&P 500 ETF (SPY) | 10.52% | $16,587,336 |
Unfortunately, the story of Cate’s 100% 8.16% return gets way worse.
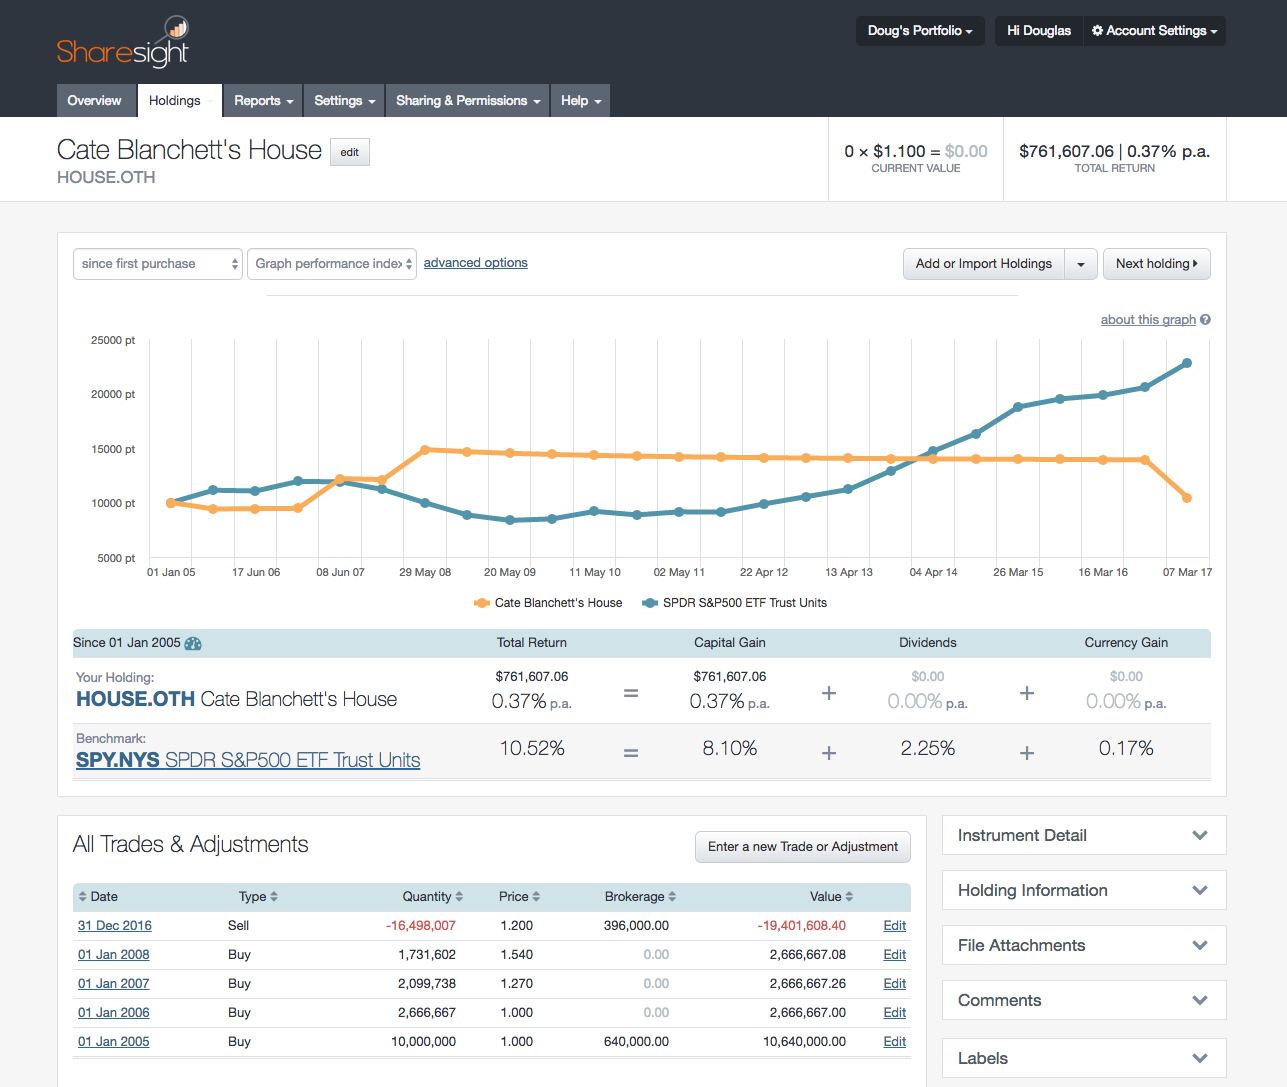
The tabloids also reported she spent $8M over three years refurbishing the property. Let’s assume that was done in three equal $2.67M projects during the first three years of ownership.
Oh and we can’t forget the stamp duty she had to pay when buying the house, which totals $640,000 plus the 2% real estate agent fee she paid when selling, which works out to be $396,000.
This drastically changes her situation. She’s had to invest heavily in the asset to justify its ultimate sale price and paid huge transaction fees. If we account for this in Sharesight, you’ll see that her annual return plummets to 0.37%!

Ultimately, in just over a decade Cate Blanchett’s $10M investment plus $8M top-up netted her $762k. If she had put the initial $10M in the S&P 500, plus the $8M top up, she’d find her balance at over $40M today.
| Total Annualized Return | Total Gain1 | |
|---|---|---|
| Cate’s House | 0.37% | $761,607 |
| S&P 500 ETF (SPY) | 10.52% | $22,698,623 |
1 Total Gain for the time period 1 January 2005 to 31 December 2016. Includes property transaction costs and assumes brokerage fees of 10 basis points on all trades.
The same rules apply to your portfolio, but the numbers elude you because they’re really hard to calculate.
The press routinely spouts off price changes in dramatic fashion, especially when it comes to IPOs. Fund managers tout their “total” or “lifetime” returns. To complicate things further, none of these talking points factor-in complexities like takeovers, spinoffs, and reinvested dividends.
Your broker or share registry simply does not have the information available to calculate accurate portfolio performance numbers on your behalf.
So unless you break down these headline numbers into annual terms and understand the true cost of investing you’ll never know your true performance, nor what your money could have done for you.
Join the discussion
FURTHER READING

Sharesight nominated for 2025 Wealth Tech Innovator of the Year
Sharesight has been chosen as a finalist in the 2025 Australian Wealth Management Awards, in the Wealth Tech Innovator of the Year category.

Prepare your annual accounts with our historical cost report
Sharesight's historical cost report is a powerful tool for investors who need to prepare annual accounts or financial statements with mark-to-market accounting.

Sharesight product updates – July 2025
This month's focus was on rolling out predictive income forecasting, as well as improved cash account syncing across different brokers and currencies.