3 reasons why your return figures may seem incorrect
As Client Support Manager at Sharesight, I sometimes receive questions from clients who claim to see an ‘incorrect’ portfolio performance figure when reviewing their portfolio overview page or specific tax and performance reports. One of the reasons we built Sharesight was to help investors understand their true performance, so we take performance calculations very seriously.
In nearly all cases, the discrepancy is often just a matter of making sure you have the right settings in place before running your reports. Here are the top 3 reasons why your portfolio performance figures might seem incorrect, and how to interpret the data.

Date Range
This is without a doubt the most common question I receive from clients. The beauty of Sharesight is that you’re able to run reports across any date range — going as far back as the purchase date of your first share holding. This is true for your entire portfolio and the individual holdings.
However if the date range is set to something else (e.g. the last 2 weeks), the calculations will not include the return on shares held as at the ‘since first purchase’ date.
Often clients compare what they see on Sharesight to what they have in their spreadsheets or online broker. Ensuring you’re comparing the same date range is critical.
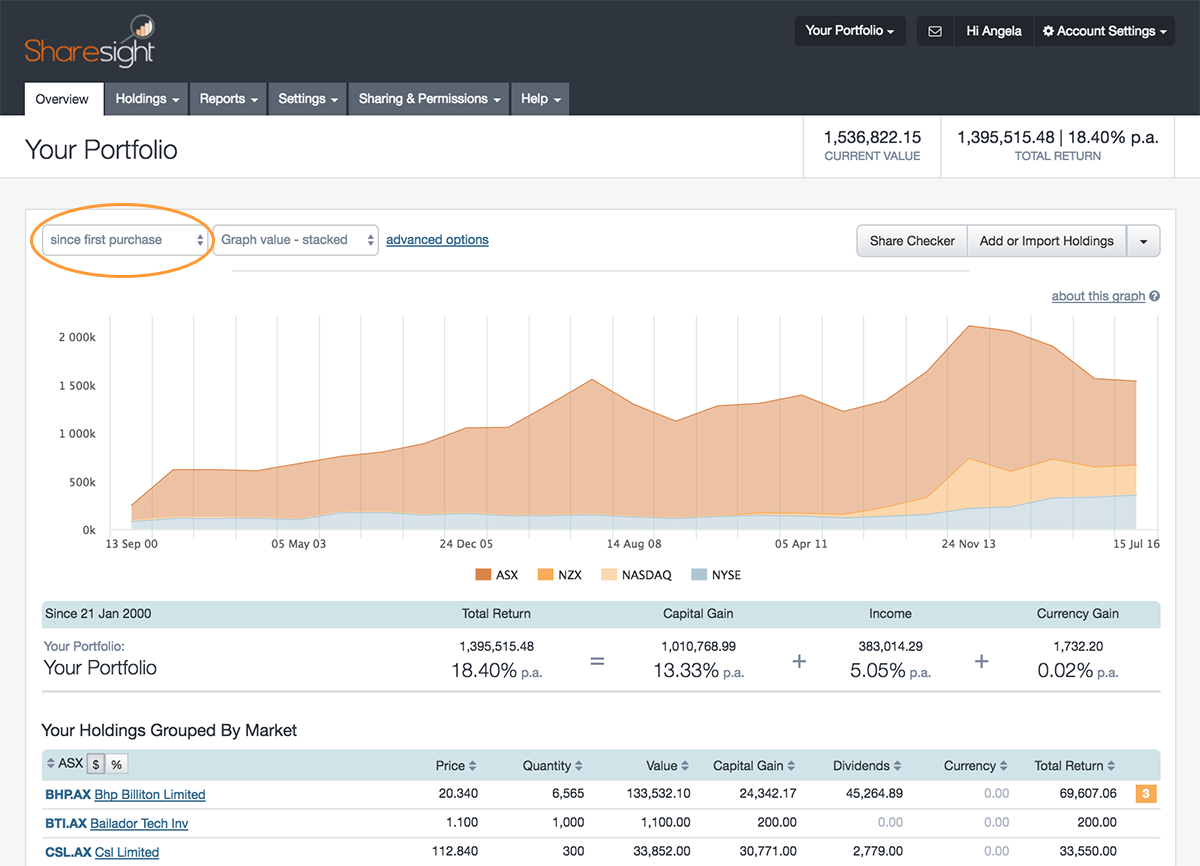
The date range setting also influences the amount/percentage of dividend income, as only those dividends related to shares held between the selected date range will be included in the ‘Income’ section where your dividends are listed. To change the date range on the Portfolio Overview page or any tax or performance report, have a look at the following video:
Note: Any changes you make to the date range settings are saved in your portfolio, so they are pre-set the next time you login.
Advanced Options
The configuration of the Advanced Options within your Sharesight portfolio(s) — specifically the ‘Open + Closed Positions’ settings — also affect return portfolio performance figures.
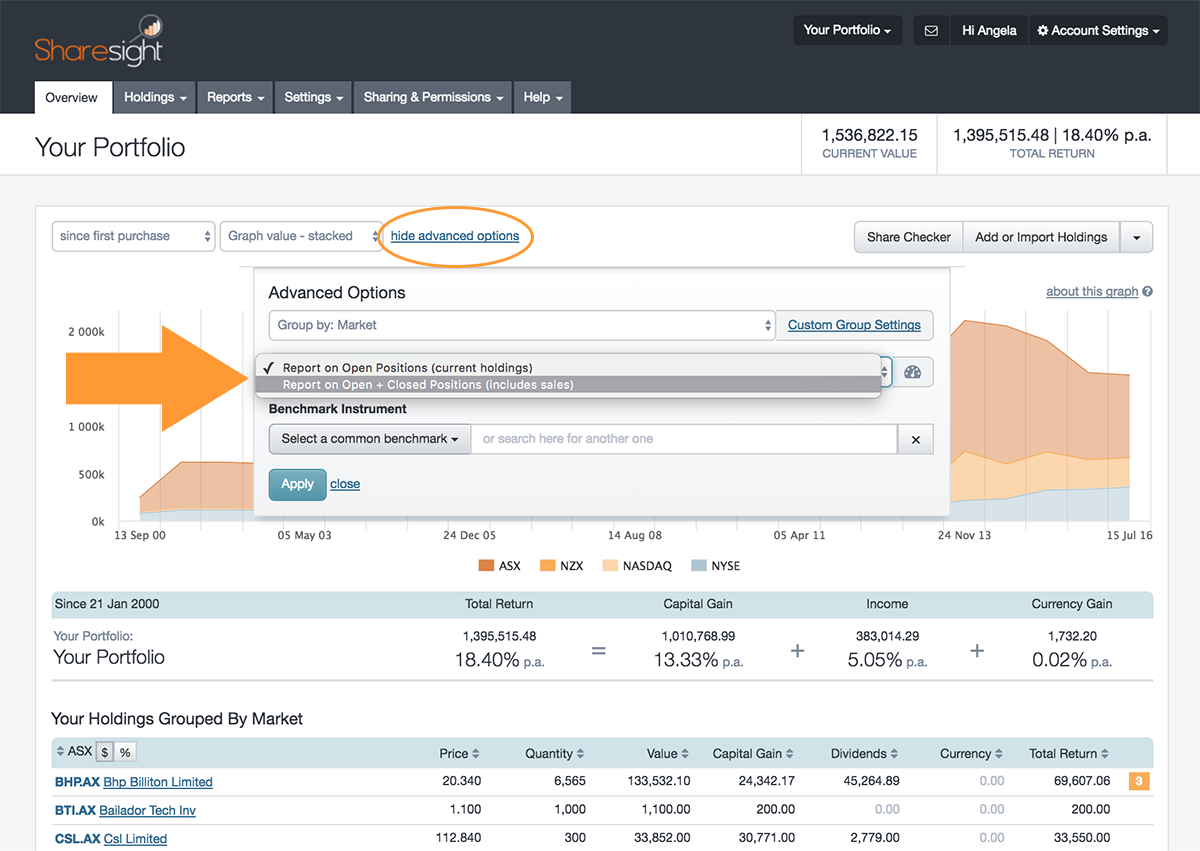
By default, the Portfolio Overview Page and the Performance Report are set to display only currently held, or ‘Open Positions’. This causes the Performance and CGT Report to exclude your sold, or ‘Closed Positions’, which in turn might lead to unexpected return figures. To update this setting, simply follow the instructions in this video:
Notes
-
Any changes you make to the Open + Closed Positions are saved in your portfolio, so they are pre-set the next time you login.
-
On the Portfolio Overview page, Free plan clients may only report on Open Positions. You’ll need to upgrade to a Paid plan to report on Open + Closed Positions on this page.
-
All clients (including those on the Free plan) may report on Open + Closed Positions on the Performance Report by updating the "advanced options" settings.
Annualised Returns
If you’ve confirmed the date range and Open + Closed positions settings and your portfolio performance returns still seem off, the issue is likely due to Sharesight annualising your returns. For more information please refer to our Calculation Methodology help page.
Note: Portfolio annualisation only applies if you’ve held your shares for longer than one year. We apply a total return for investments held for less than one year.
Stating portfolio performance in annual versus total return terms is typically more useful for investors. Unfortunately, the financial services industry has a habit of stating things in opaque “total” or “average” terms, which is what you might be using as a basis for comparison.
For starters, annual periods are comparable to other investments, easy to understand, and more relatable to our financial lives in general. Also, an annualised approach means the Sharesight methodology can factor in the magnitude and timing of additional investments (known as a dollar-weighted return). After all, this is how most of us invest, not with one large chunk of capital, but with subsequent amounts over time.
Total returns are exactly that – they do not specify a time period. So a healthy looking total return may not be that great once you realise that it’s stated over a 25 year time period. Also watch for for terms like “average annualised return” or “average annual return”. Usually this is marketing jargon that aims to smooth over volatile or poor returns in past years.
I hope you found this article useful. Let me know if you have any questions concerning the calculations in your portfolio. You can reach me by clicking on the ‘Help’ tab in your Sharesight account.
FURTHER READING


5 ways Sharesight helps Australian investors at tax time
Learn how Sharesight’s Australian tax features can not only help you complete your tax return, but also save you time and money at tax time.


How to present portfolio tax reports clients actually understand
Portfolio tax reports don't have to generate endless client questions. Here's how to structure them so clients can review, confirm and sign off.


Record-keeping requirements for Australian investors
Find out which records the ATO requires Australian investors to keep, and how to stay on top of your investment portfolio record-keeping with Sharesight.