4 reasons to stop relying on your broker’s performance reports
As an investor, it's important to know how your portfolio is performing. But when you log in to your broker's online portal to check your portfolio performance, do you know what those numbers really mean, and more importantly, what’s missing from them?

Here are 4 reasons to stop relying on your broker's performance reports:
- No annualised total return
- Dividends are ignored
- Brokerage fees are ignored
- Currency fluctuations are ignored
1. No annualised total return
One of the biggest ways that brokers fail investors is with misleading performance reporting. That’s because they often only display the difference between the average cost paid for the investment, and the latest market price.
For example, here’s what I see when I login to my broker’s online client portal:
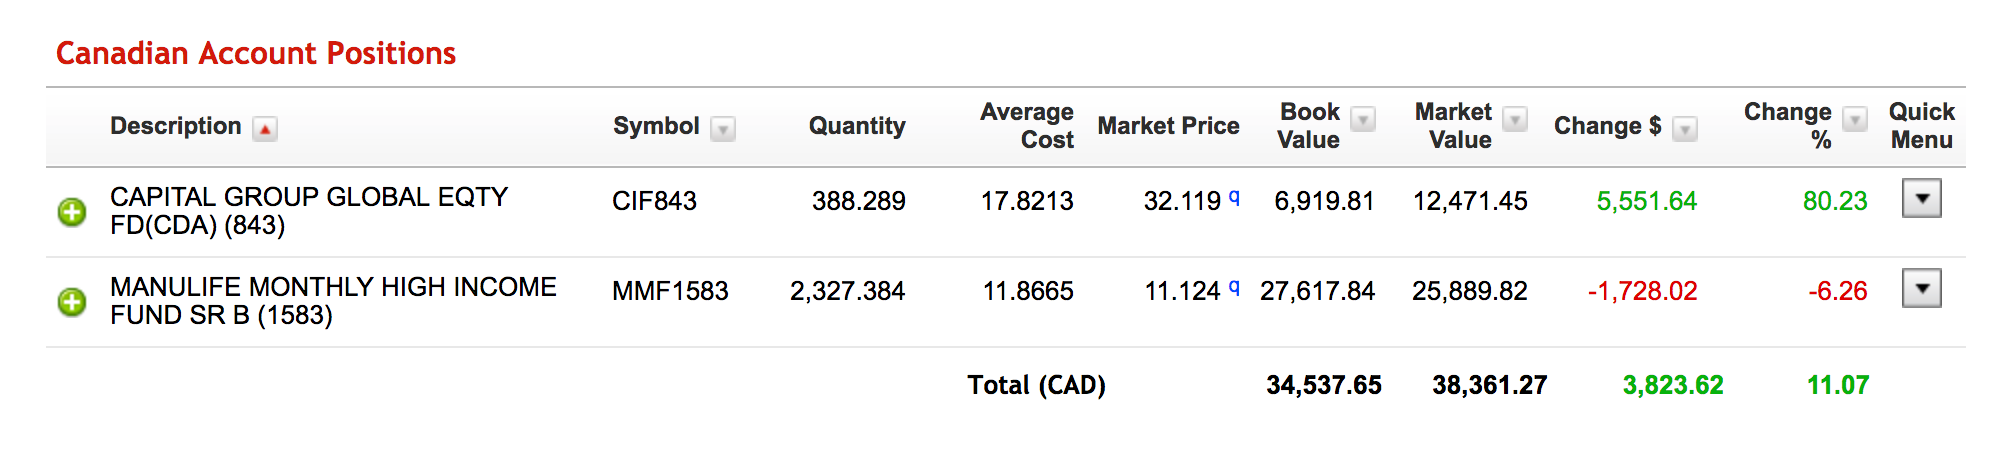
That 11% return is misleading because it’s really only telling me how I’m performing since the market last closed. As someone investing for the long term, what I really want to know is:
- How am I tracking so far this year?
- How does that compare to last year?
- What's my overall return?
- What impact are dividends having on my performance?
- How am I tracking compared to the market?
Looking at that report, I have no idea!
2. Dividends are ignored
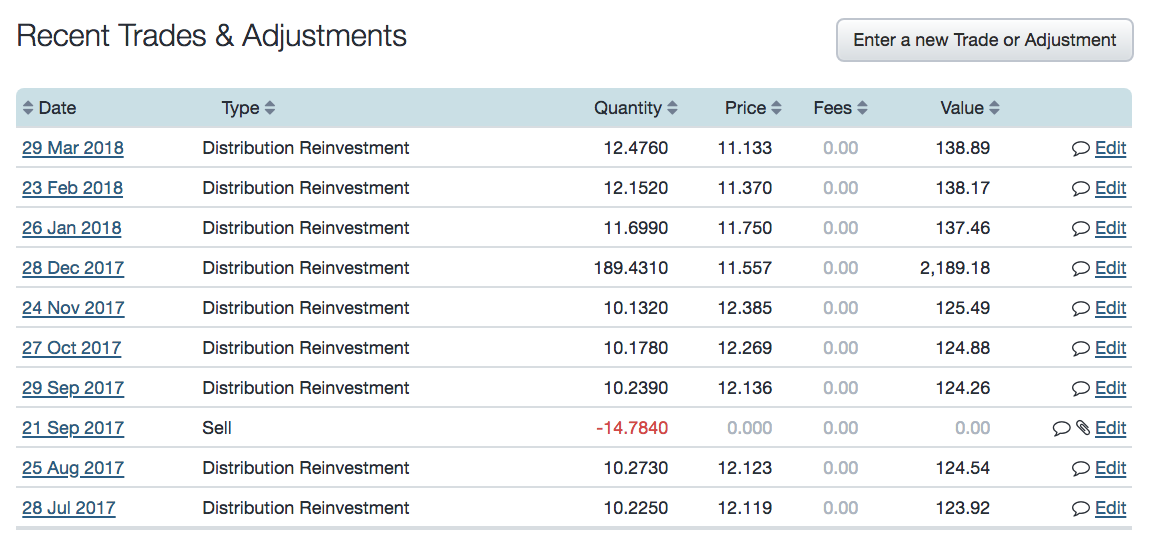
Speaking of dividends, my broker provides a transaction history which outlines the dividend income I’ve made on my investments. Here’s a snippet of that report:
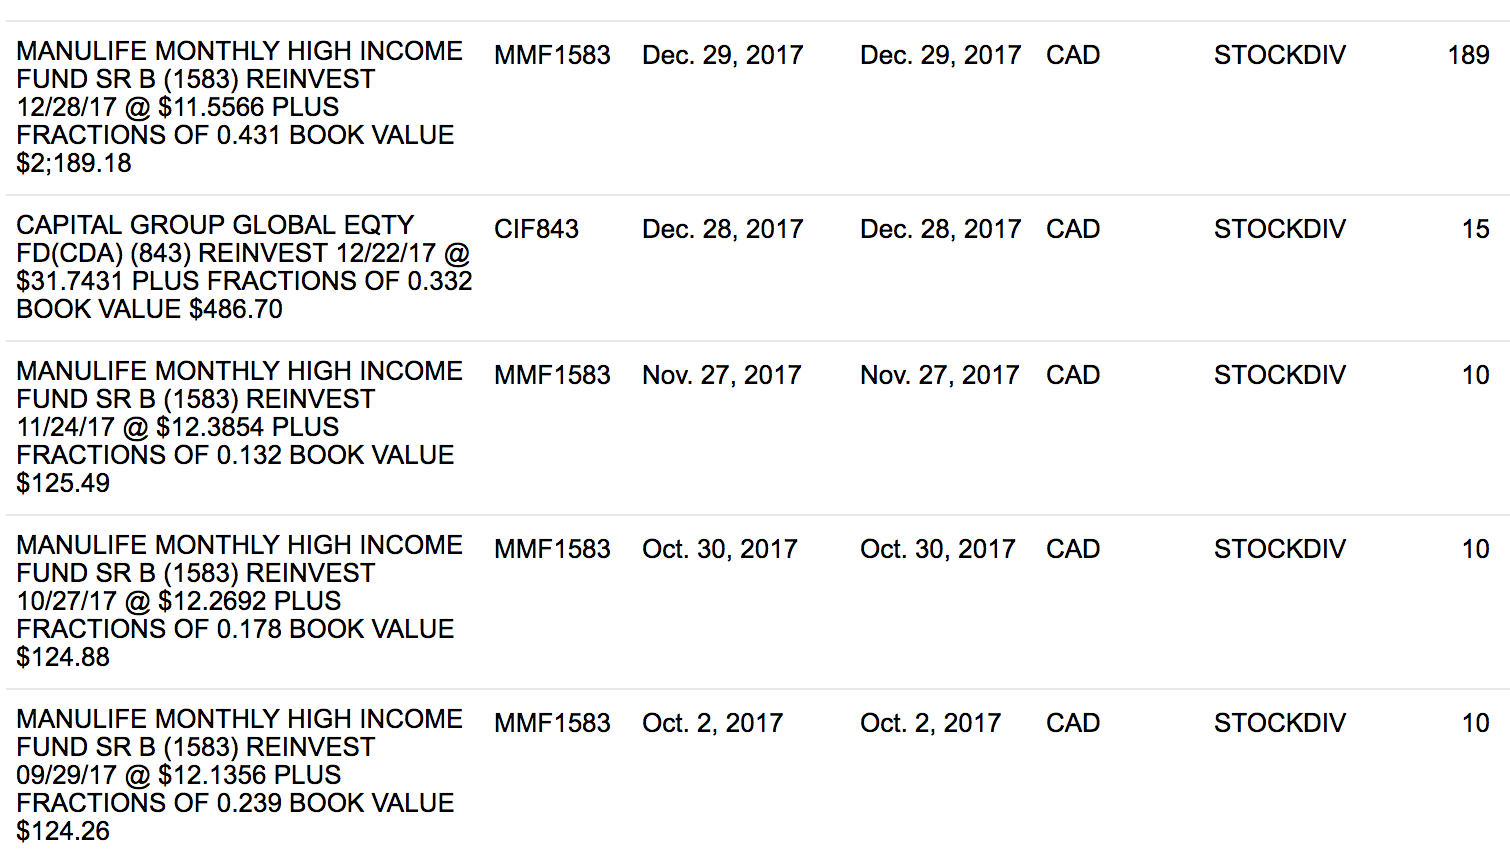
In my case, I’ve opted-in to a dividend reinvestment plan (DRIP/DRP) which allows me to purchase shares using the dividend income I’ve made off my investments. I’m therefore buying additional shares at “no cost”, ie: I’m adding shares to my account without having to spend outside money and I’m not paying brokerage fees to acquire them. This factors into my performance, and yet because of my broker’s limited reporting, I have no idea how much.
Regardless of whether I’m reinvesting my dividends or not, the obvious issue is that there’s no running total of these dividends on the report (or anywhere in my broker’s client portal, for that matter). There’s no way to see how much income I’ve made from dividends, let alone understand the impact they're having (percentage-wise) on my total performance.
3. Brokerage fees are ignored
In the current investment landscape of low-returns, it’s really important to keep track of things that eat into your performance. One such component is the brokerage fees you pay to buy or sell investments. A $10 brokerage fee on a $1000 trade might only take 1% out of your actual returns, but it can really start to add up, especially if you’re a habitual trader. And unfortunately -- you guessed it -- most brokers don’t factor brokerage fees into their performance figures.
4. Currency fluctuations aren’t factored in
In this case, my investments were purchased with Canadian funds (and are part of my Canadian retirement portfolio) so I’m not being impacted by currency fluctuations. However what if they were purchased in USD or another currency? I’d have no idea how much impact the relatively weak Canadian dollar was having on my total return. Just like dividends, most brokers don’t factor currency fluctuations into their performance figures.
Start tracking your actual performance
It’s only when I started tracking my portfolio in Sharesight that I really began to understand what was going on with my investments. Here’s how I did it:
First, I downloaded my buy/sell transaction history from my broker and uploaded it to Sharesight.
I didn’t have to worry about dividends because Sharesight automagically loaded them for me. While I could have just accepted the automated dividends, I went through each one line-by-line, and adjusted them where required to reflect what appeared in my broker’s transaction history. I found it oddly satisfying to be able to confirm every dividend, and I was amazed to see how accurate Sharesight was. Only a couple dividends were off, and only by a penny or so.
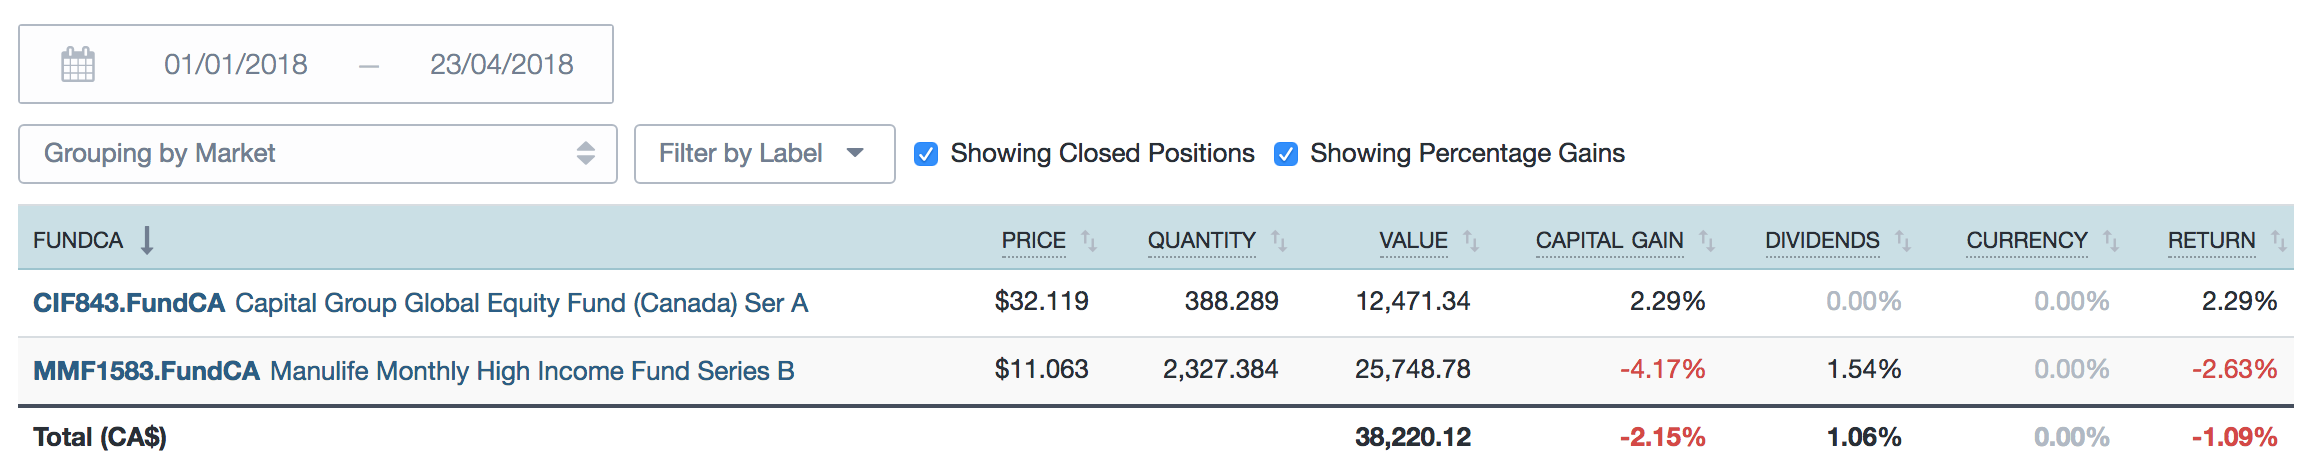
Once I uploaded my trades and confirmed all my dividends, I was able to run my Performance Report to see my returns over any period and answer those niggling questions I had earlier:
How am I tracking so far this year?
I’m currently down 1.09%:
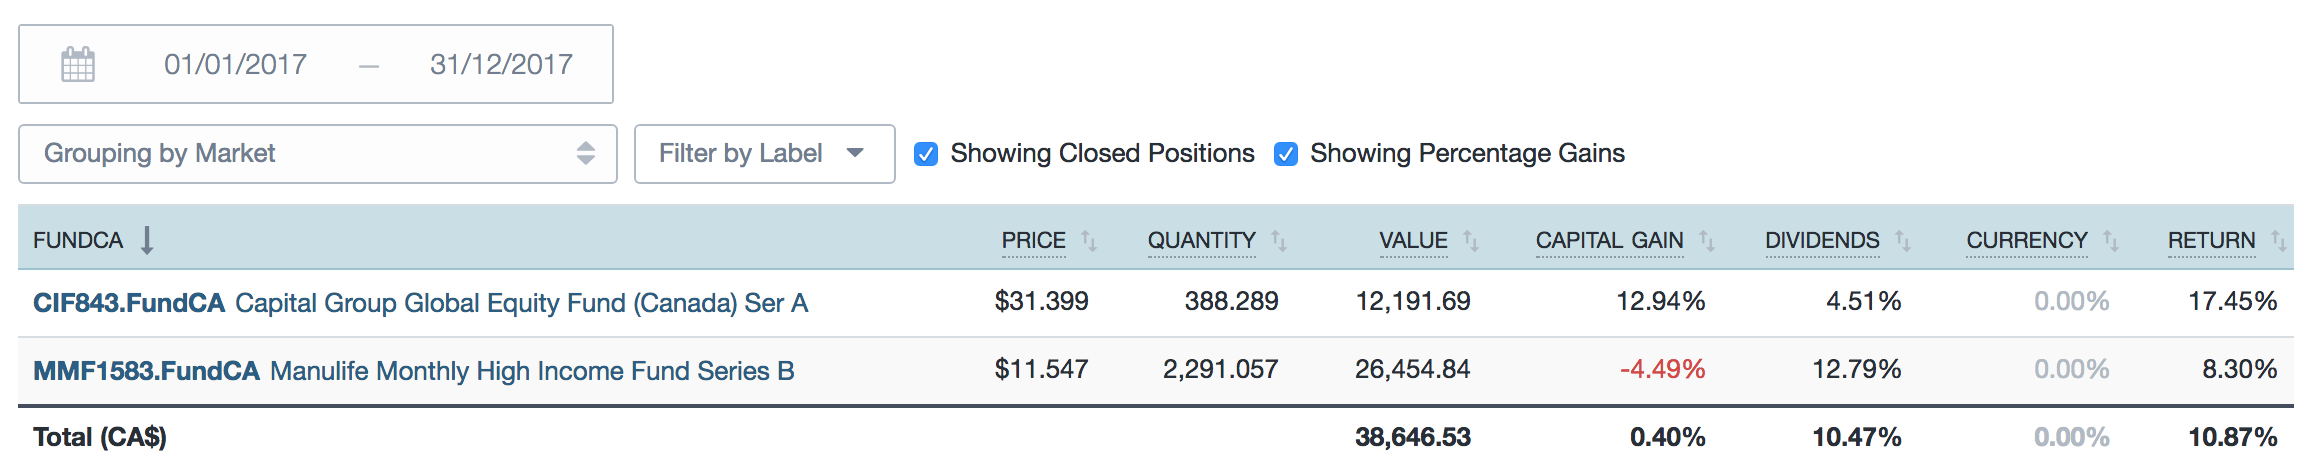
How does that compare to last year?
My return was 10.87% last year:
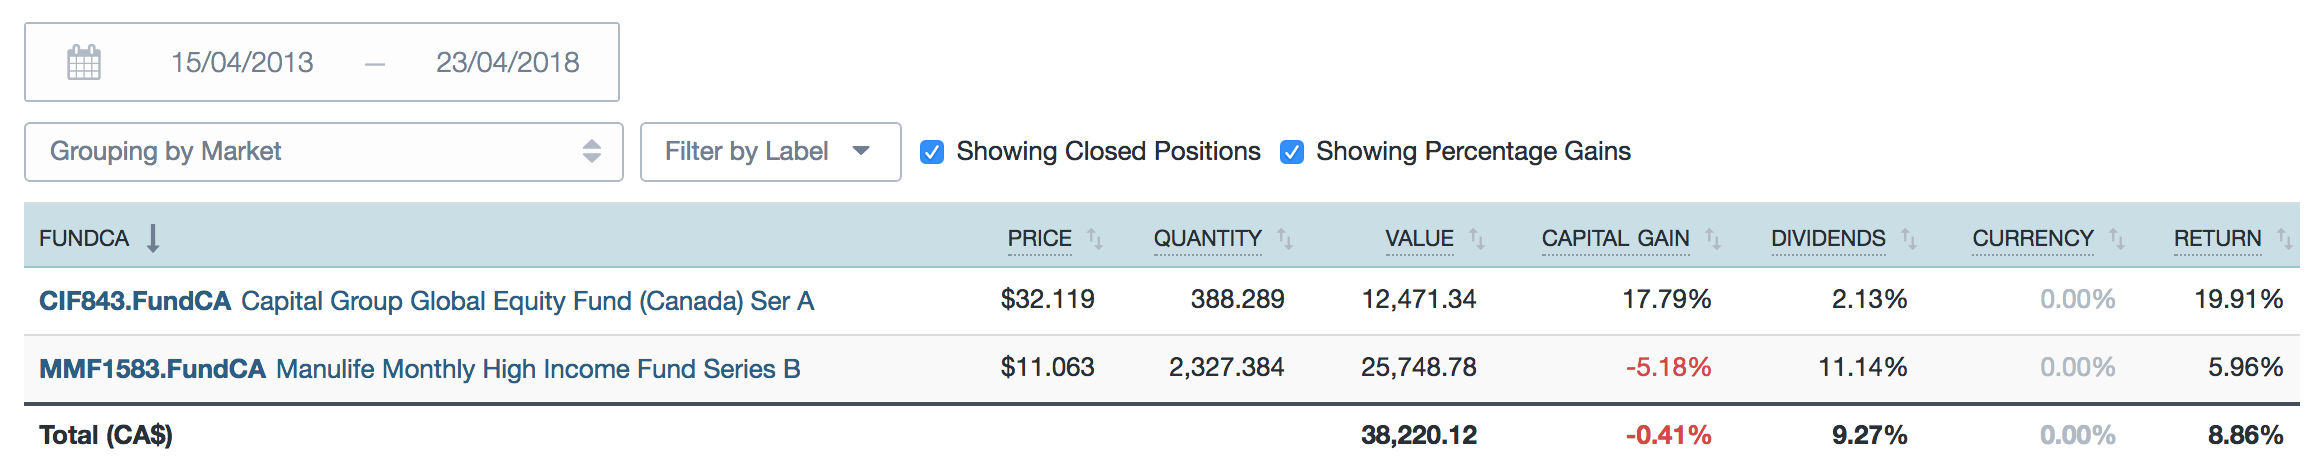
What's my overall return, and what impact are dividends having on my performance?
Since buying these mutual funds 5 years ago, my total return has been 8.86%, with dividends contributing 9.27% of that return:
That led me to wonder how I had performed against the overall market. So I used Sharesight’s Benchmarking feature to compare my portfolio against VCN:TSE, a Vanguard Canadian “All Cap” index ETF. As it turns out, I’m beating it:
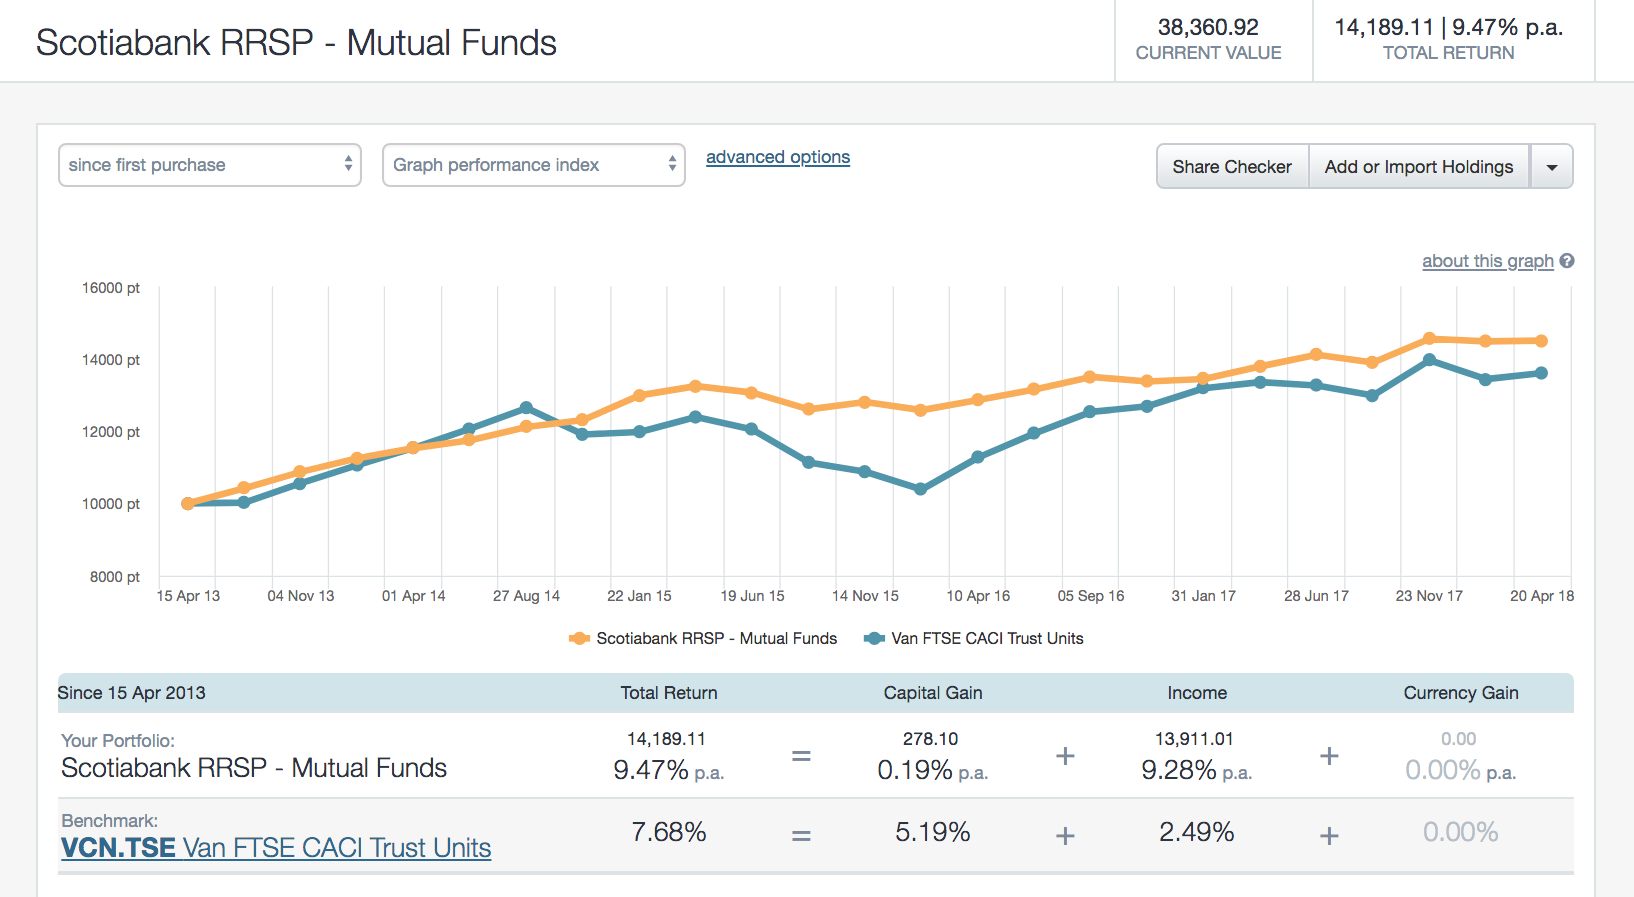
These are the types insights that really matter to investors but unfortunately aren’t provided by most brokers.
Why you need Sharesight
Unlike most brokers, Sharesight:
- Calculates your total annualised performance over any period, including either open, or open and closed (sold) positions
- Factors-in the crucial components that affect your returns: brokerage fees, dividends (including DRPs/DRIPs), and currency fluctuations
- Lets you benchmark your portfolio against any stock, ETF or managed/mutual fund
Other things you can do with Sharesight
- Get in-depth insights with the Diversity Report and Contribution Analysis Report
- Save money at tax time by running your own tax reports
- Track your portfolio on the go with the iOS and Android mobile apps
- Ensure you're on the same page as your spouse, advisor or accountant by sharing secure access to your portfolio
Recap
| Most Brokers | Sharesight | |
|---|---|---|
| Performance | Simple return Doesn’t include dividends, brokerage, currency fluctuations |
Annualised, money-weighted total return Incorporates dividends, brokerage, currency fluctuations |
| Performance Period | Limited: often only "since yesterday", or "since first purchase" | Any time period |
| Dividends | No | Yes – automatically displays the exact dividends based on how many shares you own (these can be edited), ans they are factored into your total return |
| DRPs/DRIPs | No | Yes – and included in total return |
| Foreign Currency | No currency fluctuations for foreign investments often aren’t tracked against your home currency | Yes – converts any foreign investments back to the portfolio’s home currency (on a daily basis) |
| Tax Reporting | Limited, if any | Yes |
| Benchmarking | No | Yes |
If you’re not already using Sharesight, what are you waiting for?
Join thousands of investors around the world already using Sharesight to manage their investment portfolios. Sign-up for free and import your holdings today!

FURTHER READING


Tax loss selling for Australian investors
A tax loss selling strategy can offset some of the capital gains you incurred during the year. Sharesight's unrealised CGT report can help.


EOFY checklist for Australian investors
Are you missing an EOFY opportunity? There’s still time to assess your investment portfolio and take advantage of the time left before 30 June.


Sharesight product updates – April 2026
This month's focus was on expanding US bond coverage, adding Apple/Google Pay, launching a rebuilt Australian CGT report and simplifying dividend recording.