Explore Sharesight's premium features with the demo portfolio
If you want to experience Sharesight’s premium features before upgrading to a starter, standard or premium plan, you can do this with our demo portfolio. Available to newly signed-up free plan users, the demo portfolio allows you to try virtually all of Sharesight’s features so you can decide which plan type suits your needs as an investor. In this blog we will explain where to find the demo portfolio in your Sharesight account, and how you can use it to explore Sharesight’s premium features.

Where to find the demo portfolio
If you’ve signed up for a free account after 30 June 2025, you will find the demo portfolio in the portfolio menu at the top of the page once you’ve signed into your account.

How to get the most out of the demo portfolio
With the demo portfolio, you can experience all of Sharesight’s premium reporting tools, along with the ability to benchmark your portfolio and create unlimited custom groups. Below we will highlight just a few of the advanced features you can explore with the demo portfolio.

An excerpt of the demo portfolio, which contains 20 assets across different markets and asset classes, and (in this example) has been benchmarked against VAS.
Tax reports
Sharesight has a number of reports to assist you with tax planning and compliance, including all trades, taxable income, capital gains tax (for Australian and Canadian investors), unrealised capital gains tax (for Australian investors) and historical cost. While these reports may be less interactive in the context of the demo portfolio, they are highly useful reporting tools for your personal portfolio. Therefore, if you are intending to use Sharesight for tax reporting purposes, you may wish to take a look at the taxable income report (to see all dividends/distributions in a portfolio) and the capital gains tax report (for Australian and Canadian investors) in particular.
Asset allocation and diversification reports
We have a range of advanced reports designed to help you determine your portfolio’s asset allocation and diversification. These include the diversity, exposure and drawdown risk reports — all of which we recommend you try with the demo portfolio.
For example, with the diversity report, you can get a quick view of your portfolio’s diversification based on the grouping classifications of your choice. This is useful for all investors, but especially those who have a specific asset allocation target in mind as part of their investing strategy.

The diversity report used on the demo portfolio, sorted by ‘country’.
The exposure report is another useful rebalancing tool. It shows your portfolio’s exposure to different sectors, geographies, asset classes and even individual stocks. This makes it an excellent tool for ETF investors, as it displays the underlying holdings of your ETFs, helping you uncover unnecessary overlap in your portfolio.
If you’re looking for deeper portfolio insights, the drawdown risk report uses the RoMaD metric to provide the risk-adjusted return for each investment in your portfolio. Essentially, this shows you how risky your assets are relative to each other, helping you make decisions around portfolio rebalancing based on your risk tolerance.

Investments in the upper-left quadrant are considered low-risk and high return, while those in the bottom-right quadrant are considered high-risk and low return.
Performance reports
Sharesight has a powerful suite of performance reporting tools including performance (total portfolio returns), sold securities, future income, contribution analysis, multi-period and multi-currency valuation. All of these reports are designed to give you a more comprehensive understanding of different aspects of your portfolio’s performance, but there are a few that you should definitely try on the demo portfolio.
If you rely on your investments as a source of income, it is highly recommended that you try the future income report. Not only does this report show upcoming (announced) dividends for the assets in your portfolio, but it also uses the dividend growth rate to forecast your dividend income up to three years into the future. It can even be used to review your dividend income over past periods to track changes in your income over time.

The future income report forecasting dividend income a year into the future on the demo portfolio.
Another valuable performance analysis tool is the multi-period report, which allows you to compare your portfolio’s performance over up to five distinct or cumulative past periods. This is an easy way to see the impact of a portfolio rebalance, evaluate performance before and after a market correction or even compare a portfolio’s returns against fund manager performance periods.

The multi-period report makes it easy to compare your performance over different time periods.
If you invest across different markets, the multi-currency valuation report is another performance report to try with the demo portfolio. The report allows you to see the value of your investments denoted in any of the 100+ currencies that Sharesight supports. This is especially useful when you invest in one currency (or multiple), but you ‘think’ in another.
The bottom line
No matter what kind of investor you are — whether you’re a beginner, ETF investor, income investor or a sophisticated investor — there is a Sharesight plan to suit your needs. The reports mentioned in this blog are just some of the many features you can try out using the demo portfolio. We highly recommend that you explore the demo portfolio for yourself, so you can see Sharesight’s premium features in action.
Upgrade to a starter, standard or premium plan
Upgrade your plan to unlock advanced features including tax planning and compliance tools, asset allocation/diversification reporting and deeper performance insights.

FURTHER READING

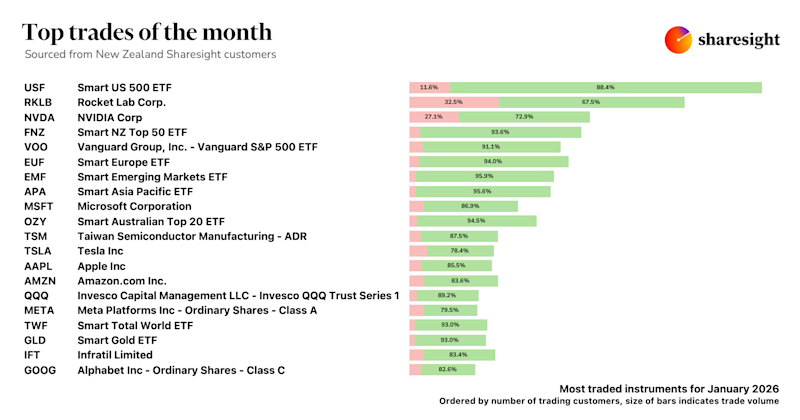
Top trades by New Zealand Sharesight users — January 2026
Welcome to the January 2026 edition of our trading snapshot for New Zealand investors, where we look at the top 20 trades made by New Zealand Sharesight users.

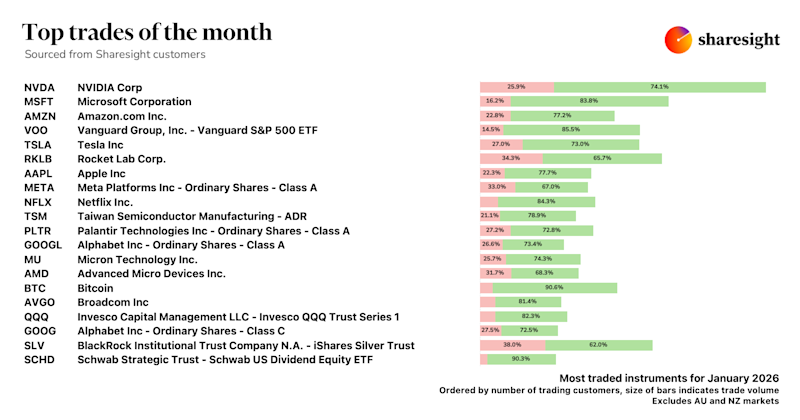
Top trades by global Sharesight users — January 2026
Welcome to the January 2026 edition of Sharesight’s trading snapshot for global investors, where we look at the top 20 trades made by Sharesight users globally.

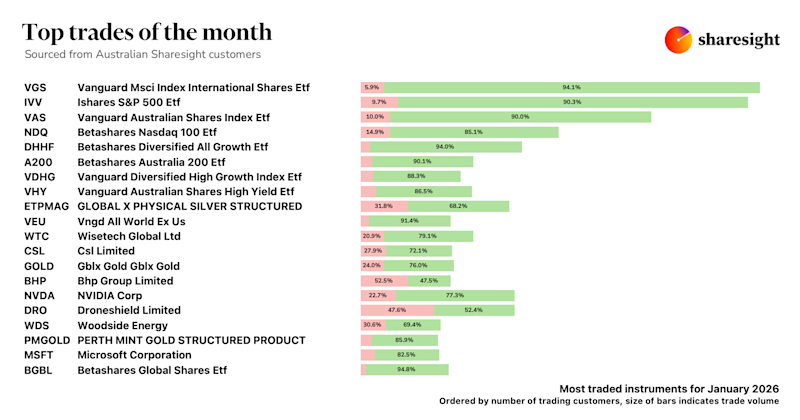
Top trades by Australian Sharesight users — January 2026
Welcome to the January 2026 edition of our trading snapshot for Australian investors, where we look at the top 20 trades made by Australian Sharesight users.