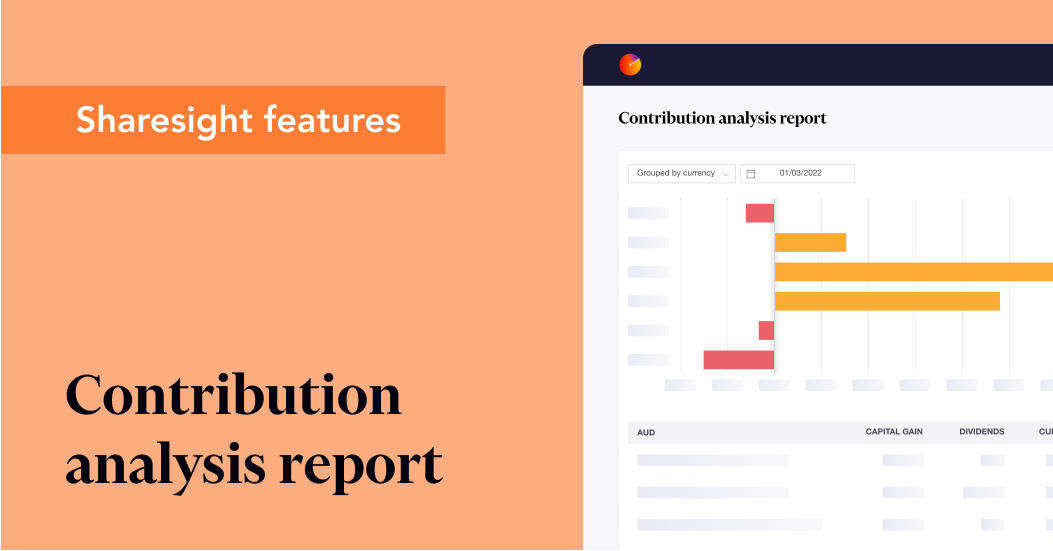
View your portfolio performance with the contribution analysis report
This article tells the story of actual Sharesight users, but names have been changed to protect their privacy. The contribution analysis report described is available on the Sharesight standard and premium plans.
In this blog, we explore how Sharesight users Nick and Katie use the contribution analysis report to get a deeper understanding of their portfolio’s performance. To learn more about the report’s features and how one couple uses this report to evaluate the success of their stock selection and asset allocation, keep reading.
What is the contribution analysis report?
Based on attribution analysis principles, Sharesight’s contribution analysis report breaks down the total return of your portfolio by the components that are driving your returns, such as stock selection, asset allocation or exposure to certain countries, sectors, or industries. This is important for investors because it helps explain how your returns are derived and where your portfolio tracks or diverges from the benchmark. Therefore, to get the most out of the contribution analysis report, Sharesight users are encouraged to add a benchmark to their portfolio and determine their asset allocation through the diversity report prior to running the report.
Key features
The contribution analysis report runs an analysis on all of the current holdings in your portfolio (with the option to also include sold positions), breaking down each holding’s total return by capital gains, dividends and currency gains. Customisable to your needs, it allows you to run the analysis over any date range, plus organise the results by market, currency, sector, industry, investment type, country, Sharesight portfolio or a custom grouping of your choice. The ability to download the contribution analysis report into an Excel spreadsheet, PDF or Google Sheet also makes it easy to share this report with a financial adviser to discuss your investment strategy.
Evaluate portfolio performance based on asset allocation
While you can run the contribution analysis report using any of the Sharesight groupings (sector/industry/country), investors like Nick and Katie use Sharesight’s custom group feature to view their performance across their asset allocation strategy.
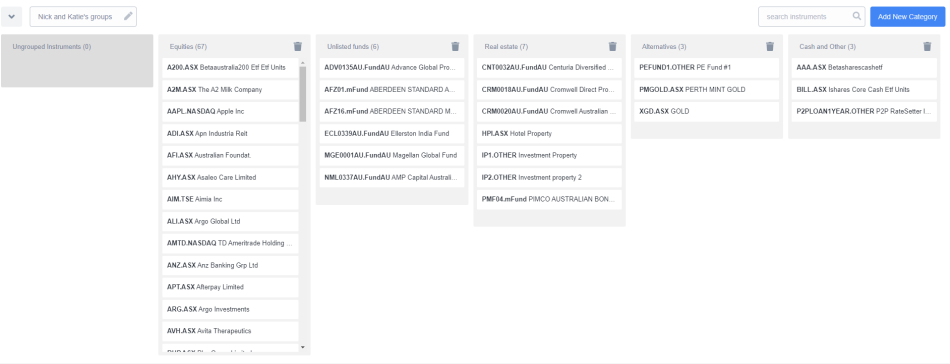
With a target asset allocation in mind for both their personal investments and SMSFs (weighted towards equities) they both set up custom groups within Sharesight. After they set up their custom groups, they allocated each of their holdings into one of the categories:
-
Equities
-
Unlisted funds
-
Real estate
-
Alternatives
-
Cash and other
They use these buckets to keep track of their asset allocation strategy.
Get deep portfolio insights with the contribution analysis report
With the contribution analysis report, they are able to dive deeper into the performance of each of their holdings by various groupings to stay on top of their portfolio.
Which asset class contributed to overall return?
At a high level, looking at the performance of their asset classes for the calendar year, it’s clear that equities have performed the best in terms of income plus capital growth.
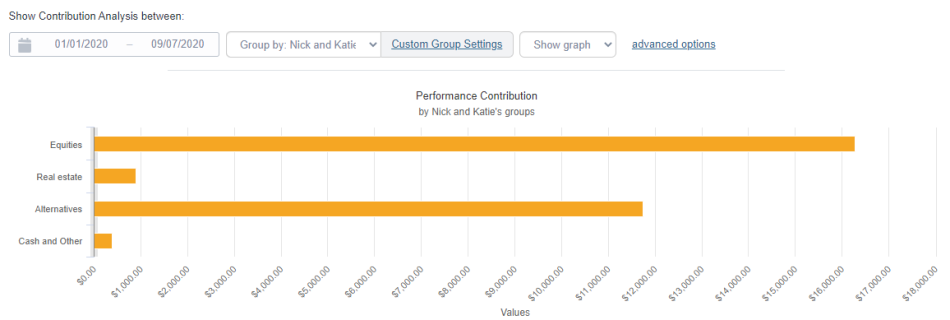
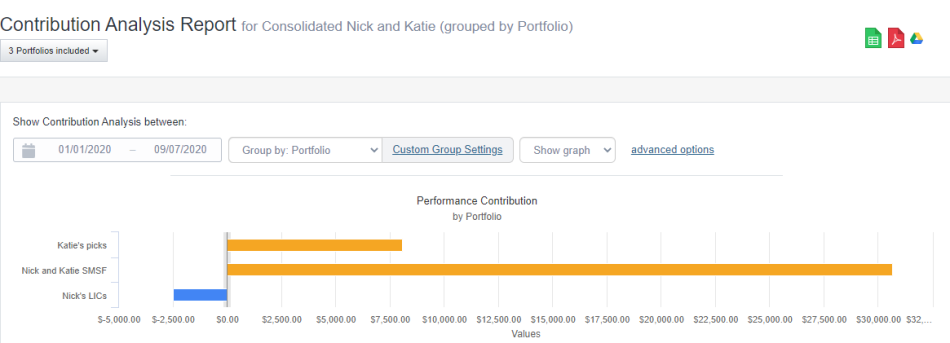
Nick and Katie’s SMSF personal portfolio contribution analysis report graph
Looking at the chart above, equities contributed the most in terms of overall return during the calendar year, followed by alternatives, real estate and finally cash and cash equivalents. Diving a bit deeper into the equities part of their portfolio, they can look at which holdings in each of their custom groups contributed to their overall return – evaluated through the prism of capital gains, dividend and currency gains.
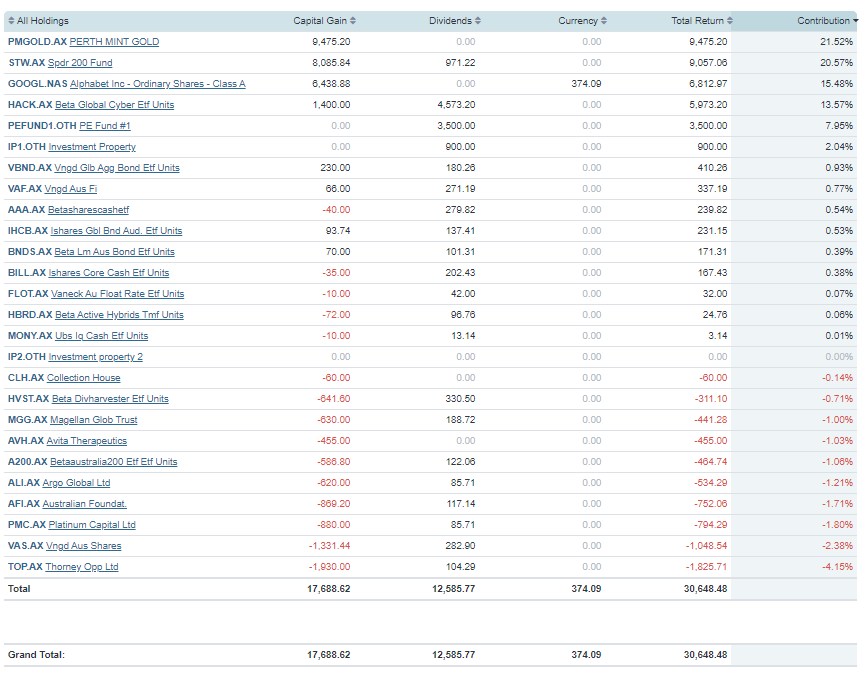
How much did each holding contribute to overall return?
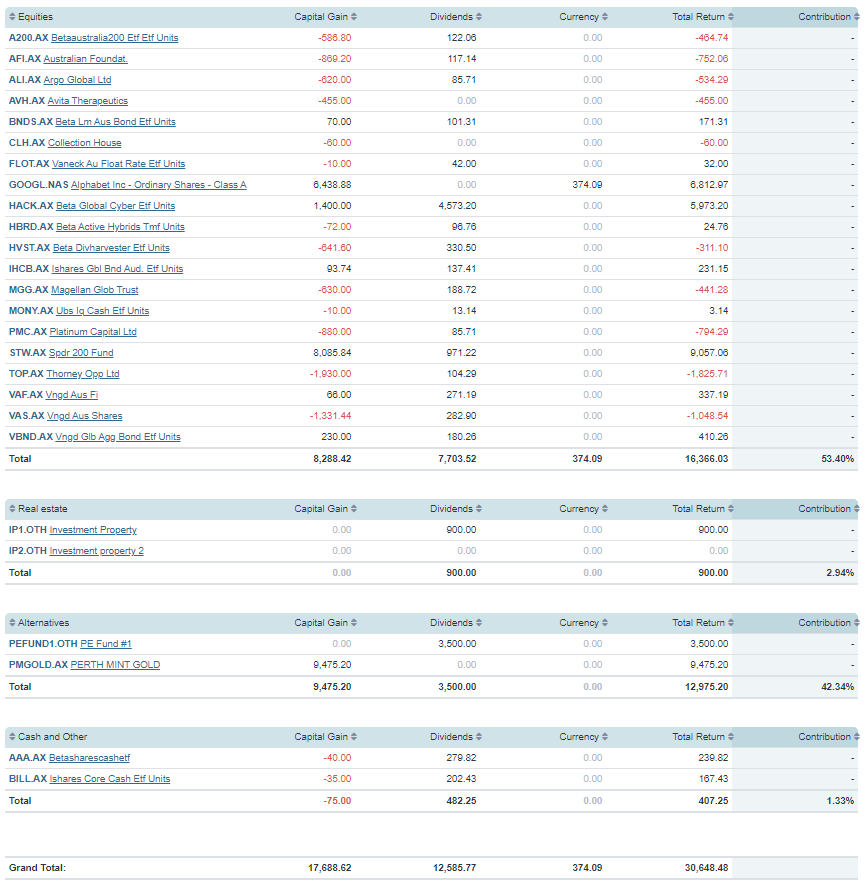
To calculate the contribution of each holding, Nick and Katie select the "do not group" option in the report setting, to evaluate how each holding in their portfolio contributed to overall performance. In the screenshot below, you will see the contribution of each holding in their portfolio, sorted in descending order.
There are multiple ways in which to look at the contribution analysis report. For example, one other way Nick looks at his overall performance is by running the report on a consolidated view, which allows him to look across multiple portfolios in a single view.
Note: All portfolios must be of the same tax residency to create a consolidated view.
 Nick and Katie have divided their investments into three different portfolios based on their tax requirements.
Some other notes while looking at the contribution analysis report:
-
The sum of the absolute values of the contribution percentages should equal 100%. For example, you need to ignore the negative signs and add the percentage numbers to arrive at 100%.
-
You can sort the order in which the holdings are presented by clicking on the header row – by holding name, capital gains, dividends, currency, total return or contribution.
-
You can also change the period of reporting by using any of the options in the date picker in the report.
-
The contribution analysis report can be run on a consolidated view as well. You can use the "group by portfolio" option to look at how each of your portfolios contributed to your overall return.
Start tracking your performance with Sharesight
If you, like Nick and Katie, are tired of tracking multiple investment portfolios across spreadsheets and wasting time on end-of-year admin with your accountant that could be better spent looking at your investment situation, now is the time to try Sharesight. With Sharesight you can:
-
Track all of your investments in one place, including global stocks, ETFs, mutual/managed funds, property and even cryptocurrency
-
Automatically track your dividend and distribution income from stocks, ETFs and mutual/managed funds
-
Run powerful reports built for investors, including performance, portfolio diversity, contribution analysis, multi-period and multi-currency Valuation
-
Easily share access to your portfolio with family members, your accountant or other financial professionals so they can see the same picture of your investments that you do
Sign up for a FREE Sharesight account and get started tracking your investment performance (and tax) today.
Disclaimer: The above article is for informational purposes only and does not constitute a specific product recommendation, or taxation or financial advice and should not be relied upon as such. While we use reasonable endeavours to keep the information up-to-date, we make no representation that any information is accurate or up-to-date. If you choose to make use of the content in this article, you do so at your own risk. To the extent permitted by law, we do not assume any responsibility or liability arising from or connected with your use or reliance on the content on our site. Please check with your adviser or accountant to obtain the correct advice for your situation.
FURTHER READING


Sharesight nominated for 2025 Wealth Tech Innovator of the Year
Sharesight has been chosen as a finalist in the 2025 Australian Wealth Management Awards, in the Wealth Tech Innovator of the Year category.


Prepare your annual accounts with our historical cost report
Sharesight's historical cost report is a powerful tool for investors who need to prepare annual accounts or financial statements with mark-to-market accounting.


Sharesight product updates – July 2025
This month's focus was on rolling out predictive income forecasting, as well as improved cash account syncing across different brokers and currencies.