How to track your asset allocation strategy in Sharesight
Legendary hedge fund manager Ray Dalio says that that "diversifying well is the most important thing you need to do in order to invest well". In order to diversify well however, investors need to master one of the key methods of portfolio diversification – asset allocation. In this post, we’ll examine how to actually keep your asset allocation on target using Sharesight.

Tracking asset allocation with Sharesight’s custom groups feature
When running Sharesight’s diversity report, the default reporting groupings are based on one of six criteria: Market, Sector classification, Industry classification, Investment type, Country or no grouping at all.
Investors can, however, take a different approach to defining their asset allocations outside the six default criteria groups by using Sharesight’s custom groups feature. Using custom groups, an investor is able to assess how their portfolio is tracking against a self defined asset allocation target at a given point in time.
Below is an example of custom groups that aligns with an investment strategy described by Graham Hand in this blog post.
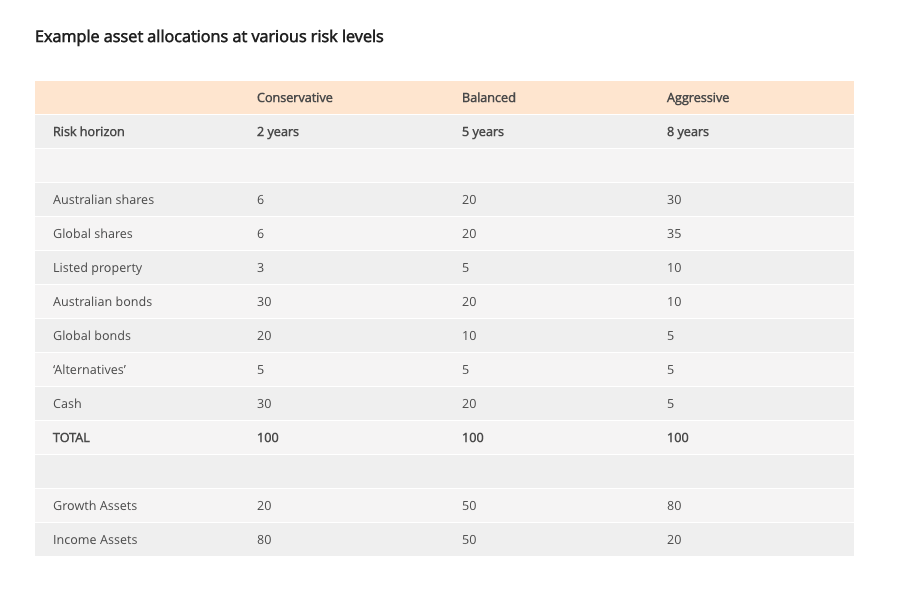
Tagging holdings using custom groups
Using the above asset allocation groupings we could create the following in Sharesight:
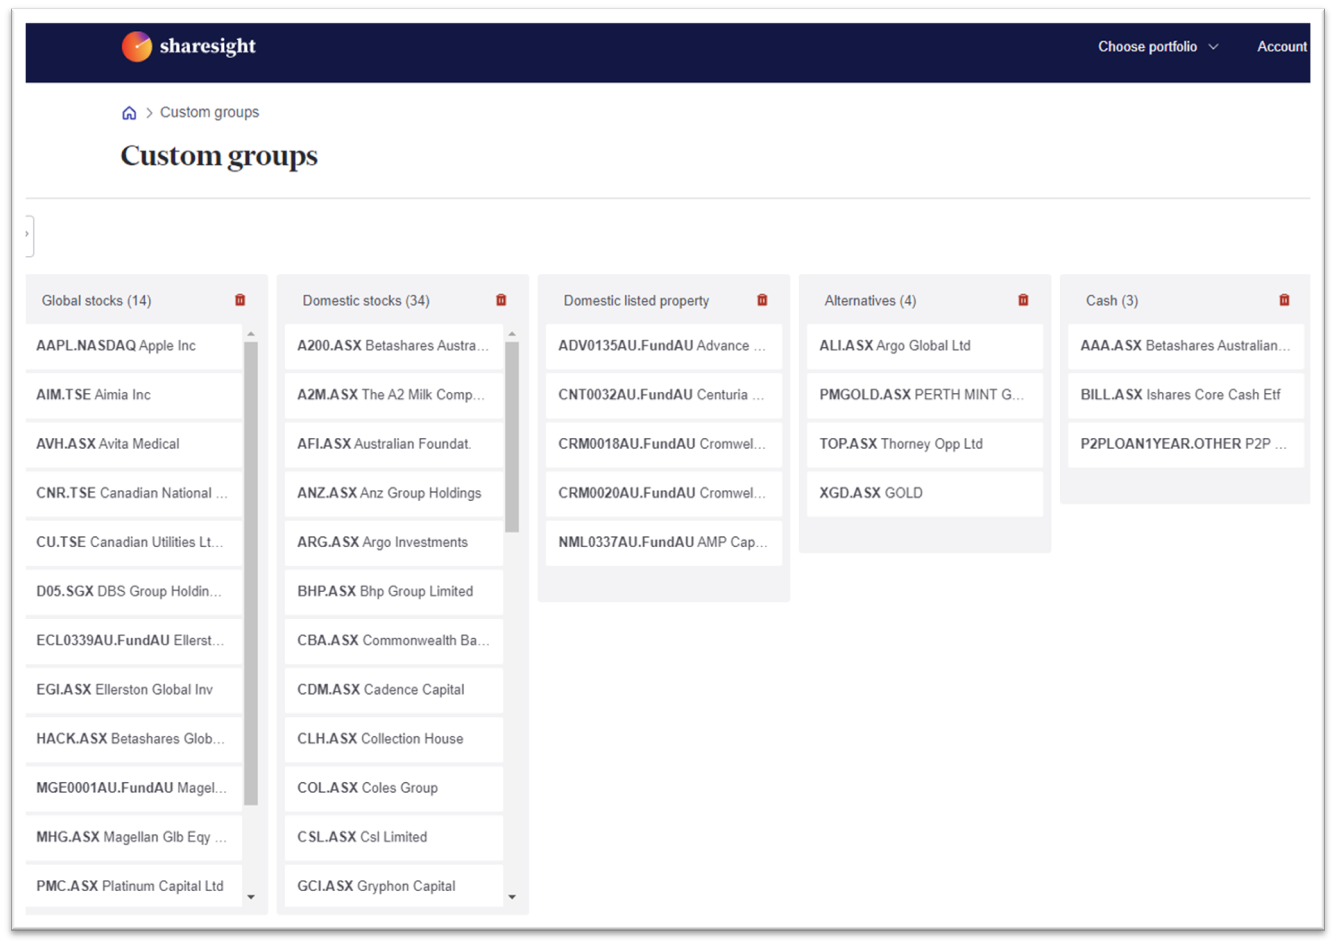
By tagging holdings in a particular custom group, an investor could then run the diversity report to see how they are progressing against their planned asset allocation, then adjust their allocation by either investing more in assets that are under-allocated, or selling assets that are overexposed.
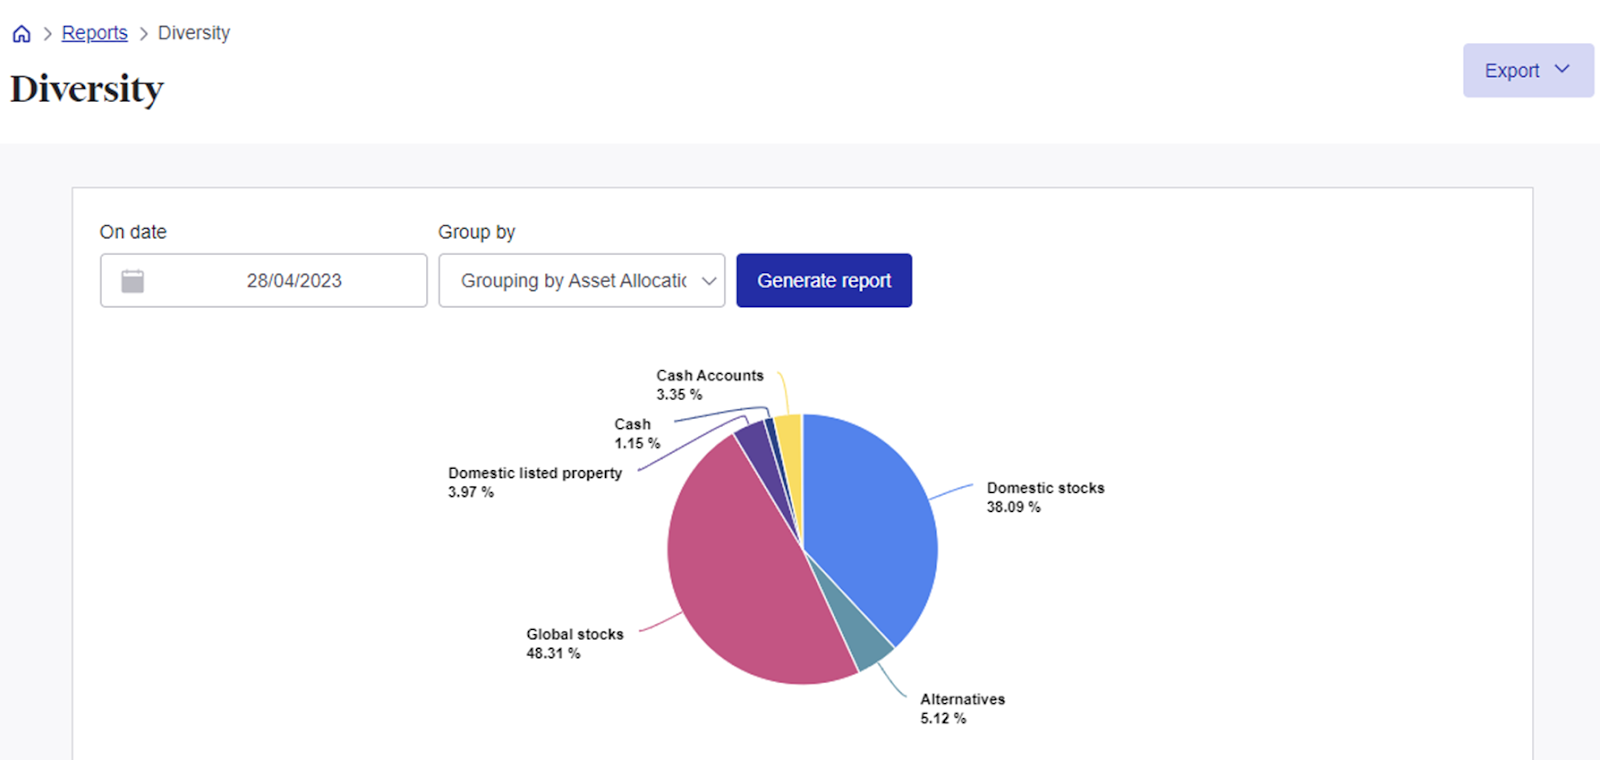
The diversity report of individual components of a custom group looks like the below.
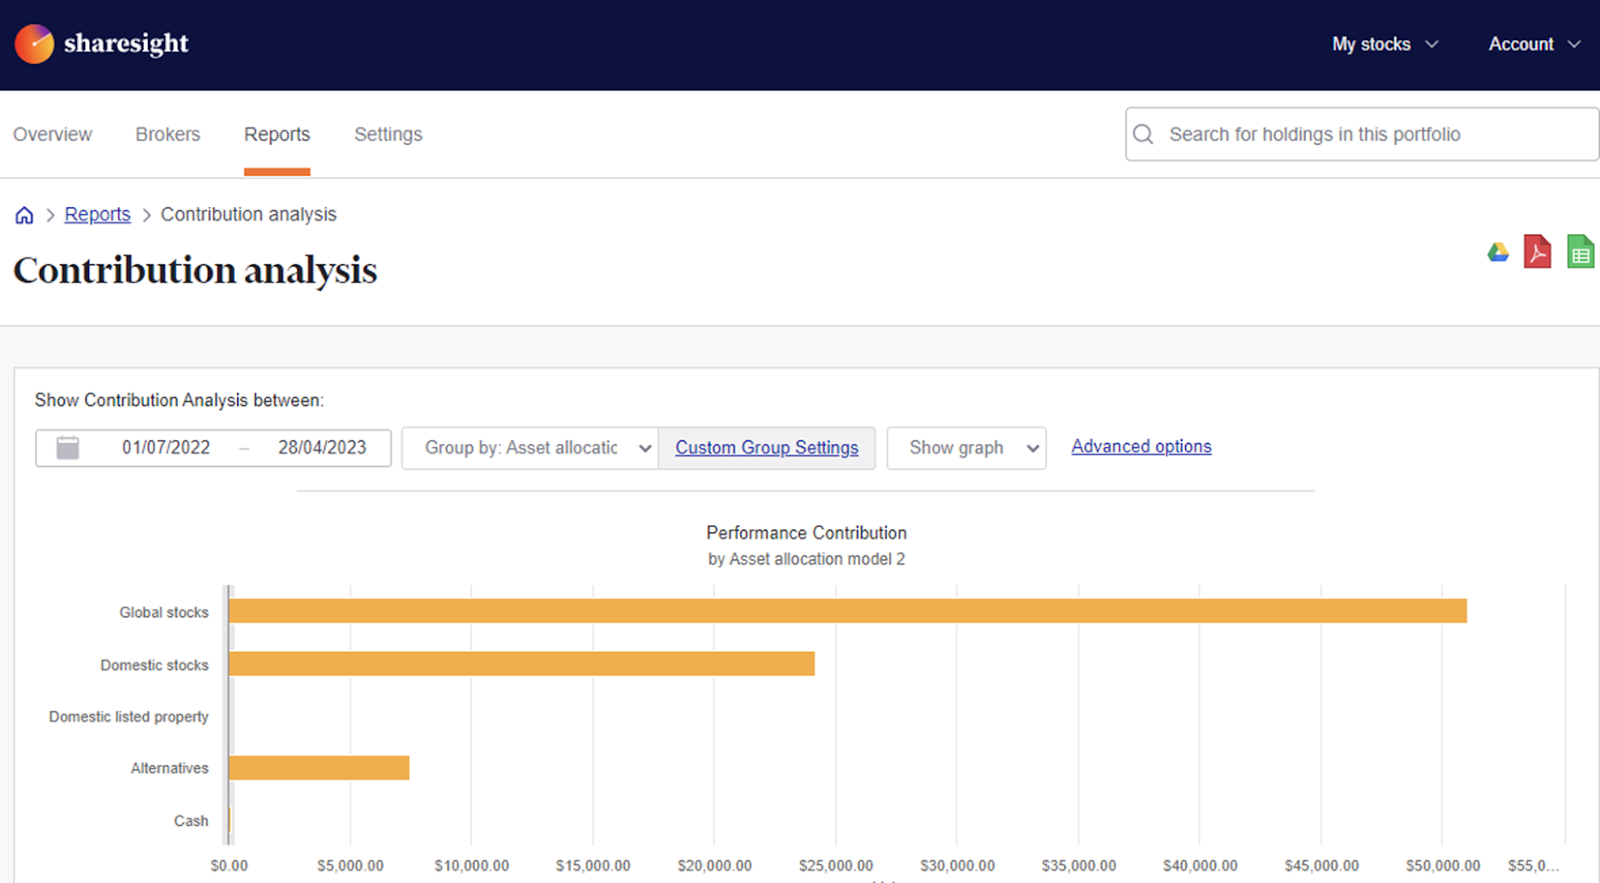
Investors can also explore which asset classes are contributing to their overall portfolio performance by running Sharesight’s contribution analysis report:
For more information on how to use custom groups, see our instructional video:
Embedded content: https://www.youtube.com/watch?v=kWJmJbgvlEc
Be a rational and disciplined investor
A big part of being a disciplined investor is to document your investment strategy. The above reports and features are two of the ways Sharesight makes it easy to track asset allocation and your investment performance.
With Sharesight you can:
-
Get the true picture of your investment performance, including the impact of brokerage fees, dividends, and capital gains with Sharesight’s annualised performance calculation methodology
-
Automatically track your daily price & currency fluctuations, as well as handle corporate actions such as dividends and share splits
-
Run powerful tax reports built for investors, including capital gains tax (Australia and Canada), unrealised capital gains, (Australia) and taxable income (All regions)
The best way to understand what Sharesight is all about is to sign up and try Sharesight for yourself. We’re confident that you’ll agree that it’s the best portfolio tracker for investors.
Disclaimer: This article is for informational purposes only and does not constitute a specific product recommendation, or taxation or financial advice and should not be relied upon as such. While we use reasonable endeavours to keep the information up-to-date, we make no representation that any information is accurate or up-to-date. If you choose to make use of the content in this article, you do so at your own risk. To the extent permitted by law, we do not assume any responsibility or liability arising from or connected with your use or reliance on the content on our site. Please check with your adviser or accountant to obtain the correct advice for your situation.
FURTHER READING

Sharesight nominated for 2025 Wealth Tech Innovator of the Year
Sharesight has been chosen as a finalist in the 2025 Australian Wealth Management Awards, in the Wealth Tech Innovator of the Year category.
Prepare your annual accounts with our historical cost report
Sharesight's historical cost report is a powerful tool for investors who need to prepare annual accounts or financial statements with mark-to-market accounting.

Sharesight product updates – July 2025
This month's focus was on rolling out predictive income forecasting, as well as improved cash account syncing across different brokers and currencies.