TSX-60 sector and stock performance 2013-2018
Since investors using Sharesight typically tend to lean towards a ‘buy and hold’ investing philosophy, it’s important to look at returns over longer periods. In this post, we’re examining the returns of stocks in Canada’s TSX-60 (TSE-60) index and the corresponding returns for each sector and key stocks in each sector of the index in order to look for underlying trends over the last 5 years (2013-2018).
Sharesight performance calculation methodology
Sharesight calculates annualised returns that include dividends - we do this using a dollar weighted return calculation method when there are multiple buy/sell trades within a measurement period. For this exercise we "purchased" a single parcel of each stock on 1 Jan 2013 and used Sharesight’s performance report to calculate the annualised return including dividends (total annualised return) through to 31 December 2018. In this post we've used Sharesight's compounded annual return to calculate these annualised returns.
TSX-60 performance 2013-2018

Using the iShares S&P/TSX 60 Index ETF as a proxy to capture the dividend and capital gain performance of the TSX-60 index in Sharesight (read our rationale for benchmarking your portfolio against ETFs), we find an extremely strong performance for the index through to August 2014 before falling away, underpinning the importance of understanding the impact of holding periods in your investment performance.
Over the 5 years from 1 January 2013 to 31 December 2018, TSX:XUI recorded a 6.81% total annual return, with 3.37% of that return coming from dividends.
Performance of each sector in the TSX-60
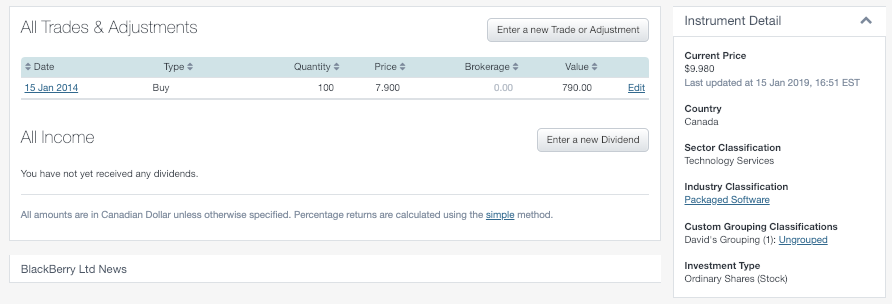
Sharesight uses the FactSet Revere Business Industry Classification System to classify companies by industry and sector (when looking at a holding in Sharesight, this information is available in the ‘instrument detail’ section).
We used this sector break down to split out the performance by sector within the TSX-60 over the 2013-2018 period. Here’s that performance by sector -- simply click on a sector for more info:
TSX-60 performance by sector 2013-2018

NOTE: All return figures per annum total return including dividends
1. Commercial services: 51.04%

CCL.B CCL Industries Inc: 84.39%
-
Jun 21 2014: CCL Industries acquired Sancoa and TubeDec
-
Jan 4 2019: CCL industries announced Bolt-on acquisition for Avery
TRI Thomson Reuters Corp: 17.70%
- Dec 15 2018: The director of Thomson Reuters Corp sold 23,102 shares of the stock in a transaction
2. Communication: 11.95%
RCI.B - Rogers Communication Inc: 13.30%
-
Dec 17 2018: Mackenzie financial corp grew its stake in Rogers communication inc by 23.3% during the third quarter
-
Dec 16 2016: Rogers Communication took a $525 Million hit as it killed plans to adopt IPTV, instead adopting Comcast’s platform
T - Telus Corp: 11.86%
-
Apr 17 2013: Telus performed a share split with a ratio of 1:2
-
Dec 3 2015 Telus introduced a new portfolio of leading-edge cloud services for Canadian Business
BCE - Bell Canada Enterprises Inc: Total return 10.68%
-
Jul 23 2014: BCE announced acquisition of regional telecom unit Bell Aliant for $3.95 Billion
-
Sep 24 2018: BCE extended LTE advanced wireless coverage in southeastern Manitoba
3. Consumer Non-Durables: 17.46%
GIL - Gildan Activewear Inc: 23.43%
-
Dec 5 2018: Gildan Activewear shares increased 10.2% because the company benefited from a significant increase in demand for activewear
-
Mar 23 2015: Gildan Activewear performed a 1:2 share split
SAP - Saputo Inc: 11.49%
-
Sep 30 2014: Saputo Inc performed a 1:2 share split
-
Jun 21 2016: SAP seeked to purchase 1,291,000 common shares through private agreements
4. Consumer services: 12.99%
QSR - Restaurants Brand International Inc: 22.80%
- December 12 2014: Completed transaction between Tim Hortons and Burger King to create Restaurant Brands international
SJR.B - Shaw Communication Inc: 6.34%
-
Dec 12 2018: TransLink and Shaw announced free wifi on entire transit system
-
Feb 18 2015: NSI introduced new partnership
5. Electronic technology: -5.06%

BB - Blackberry limited: -3.01%
-
Dec 13 2018: Shares of Blackberry hit a new low at CA$10.55
-
Sep 7 2015: Blackberry acquired Good Technology for $425 million
BBD.B - Bombardier Inc: -7.11%
-
Feb 1 2017: Bombardier and City Jet finalised purchase agreement for 10 CRJ900 Aircraft
-
Dec 21 2018: Bombardier to supply additional Francilien trains to lle-de-France Mobilitie in Greater Paris
6. Energy minerals: -4.17%
SU - Suncor Energy Inc: 6.21%
-
Jan 7 2016: Suncor energy Inc performed a hostile takeover of Canadian Oil Sands ltd
-
Nov 2 2017: Suncor energy and PetroNor announced agreement on equity partnership
-
Dec 14 2018: Suncor warned that forced provincial oil cutbacks pose safety, operational risks
CNQ - Canadian Natural Resources ltd: 5.86%
-
Jan 12 2015: Canadian Natural resources ltd cut capital spending by nearly 30% because of oil price
-
Dec 5 2018: Canadian natural resources cut 2019 capital budget by $1 billion due to poor prices for western Canadian oil
IMO - Imperial Oil ltd: -1.62%
-
Dec 17 2013: Imperial Oil ltd planned $7 billion oil sands project despite cost forecasts
-
Jun 16 2015: Imperial Oil began production at Kearl oil sands project as expansion completed early
7. Finance: 13.13%
BAM.A - Brookfield Asset Management Inc: 21.78%
- Nov 19 2014: Abandoned a US$110 Million deal to buy Atlantic cities bankrupt revel casino hotel
SLF - Sun life Financial Inc: 18.06%
-
Feb 7 2017: Sun Life Financial announced a new partnership with the Kansas City Royals
-
Dec 10 2018: Implemented a stock repurchase plan with its designated broker
TD - Toronto-Dominion Bank: 15.26%
-
Feb 3 2014: TD Bank performed a 1:2 share split
-
Jul 12 2017: TD donated $50,000 for red cross for disaster relief in British Columbia News Source
8. Health technology: -9.73%
BHC - Bausch Health Companies Inc: -9.73%
-
Nov 15 2017: Bausch+ Lomb to recycle more than one million contact lenses within the first year of the launching the ONE by ONE Recycling program
-
Jan 3 2019: Health Canada issued approval of VYZULTA for treatment of Glaucoma
9. Industrial services: 16.77%
WCN - Waste Connection Inc: 69.85%
- Jul 19 2017: Waste Connection performed a 2:3 share split
PPL - Pembina Pipeline Corp: 13.70%
- Dec 12 2018: It was announced that PPL director Bruce D Robin purchased 4000 shares of the stock in a transaction on November 19 2018
TRP - TransCanada Corp: Total return 5.35%
- Dec 8 2015: TransCanada announced intention to buy back shares through private agreement
- Dec 17 2018: Trans Canada agreed to sell Coolidge generating station for US$465 Million
10. Non-energy minerals: 38.78%
TECK.B - Teck Resources Ltd: Total return 372.07%
-
Oct 22 2015: Recorded $2.1 billion loss - writes down resource assets
-
Dec 4 2018: Teck Resources sold 30% stake in Chile copper project to Sumitomo for $1.2 billion
11. Process industries: -12.36%
NTR - Nutrien ltd: -12.36% p.a.
- Oct 1 2018: Nutrien announced CFO retirement
12. Producer manufacturing: 29.58%

MG - Magna International Inc: 29.58%
-
Sep 30 2014: Magna international announced the signing of an agreement to acquire the techform group of companies
-
Mar 23 2015: Magna International Inc. announced that it was doing a 1:2 share split
-
Dec 18 2018: Magna acquired VIZA Geca to bolster its seating capabilities
13. Retail Trade: 25.87%
ATD.B - Alimentation Couche Tard Inc: 54.32%
-
Apr 21 2014: Alimentation couche tard announced a share split, the ratio was 1:3
-
Dec 18 2014: The company acquired The Pantry to expand in the southern US in a deal worth $1.7 billion
-
Jun 19 2017: Alimentation Couche Tard priced private offering of senior unsecured notes
DOL - Dollarama Inc: 39.65%
-
Mar 30 2017: Dollarama announced plans to open 1700 stores
-
September 14 2017-Dollarama announced a share buyback
MRU - Metro Inc: 23.18%
-
Oct 11 2017: Metro entered into an agreement to sell majority of its holdings in alimentation Couche-Tard
-
Oct 11 2017: Metro announced it would eliminate 280 jobs as a part of Ontario distribution network overhaul
14. Technology services: 63.66%

CSU - Constellation Software Inc: 108.80%
GIB.A - CGI Group Inc: 44%
-
May 5 2014: Investors short sell CGI due to cash concerns
-
December 10 2018: CGI Group is expected to announce sales worth $2.23 billion in quarterly sales
OTEX - Open Text Corp: 40.40%
- Apr 24 2014: Open Text Corp announced plans to create 1200 Jobs in Ontario with $120 Million grant from province
15. Transportation: 24.38%
CNR - Canadian National Railway Co: 23.63%
- Dec 17 2018: The target price for Canadian National railway co was reduced by Royal Bank of Canada from $130 to $128
16. Utilities: 9.53%
FTS - Fortis Inc: 9.78%
- Dec 12 2013: Fortis Inc announced plans to buy UNS energy for $2.5 Billion
Use Sharesight to track your TSX Toronto Stock Exchange investments
Get access to insights like this by tracking your investment portfolio with Sharesight. Built for the needs of Canadian investors:
-
Sharesight automatically tracks your daily price & currency fluctuations, as well as handles corporate actions such as dividends and share splits
-
Get the true picture of your investment performance, including the impact of brokerage fees, dividends, and capital gains with Sharesight’s annualised performance calculation methodology
-
Run powerful tax reports built for Canadian investors, including Capital Gains and Taxable Income
-
Track your TFSA, RRSP and RRIF investment accounts with tax calculations built to CRA rules
Sign up for a FREE Sharesight account and get started tracking your investments today.
FURTHER READING


Evaluate your investment returns with the performance report
One of Sharesight’s most popular reports, the performance report gives you the full picture of your portfolio’s returns over any chosen period.


5 ways Sharesight helps Australian investors at tax time
Learn how Sharesight’s Australian tax features can not only help you complete your tax return, but also save you time and money at tax time.


How to present portfolio tax reports clients actually understand
Portfolio tax reports don't have to generate endless client questions. Here's how to structure them so clients can review, confirm and sign off.