2017 stock picking competition — July update
We’re at the halfway point of the Sharesight & Livewire stock picking competition.
In December 2016 we asked clients to send in their predictions for the top performing stocks for the upcoming year. Our mates at Livewire did the same. Plus, they invited Australia’s top fund managers to give their tips.
We built an equally weighted portfolio for each group based on the stocks receiving the most votes and track them using Sharesight.
So where do we stand?

Performance
Even though there’s some commonality across the all three portfolios, the fund managers are beginning to pull away. The Livewire readers are in the middle of the pack, and even in my capacity as objective referee for this competition, it pains me to see the Sharesight portfolio trailing badly. There’s over a $69k difference between the Sharesight return and the fund managers -- after just 6 months on a $500k portfolio -- that’s significant.
Our benchmark partner, robo-adviser Six Park, is in second place.
| Portfolio | Total Return % | Total Return $ |
|---|---|---|
| Sharesight | -4.81% | $-24,233.52 |
| Fund Managers | 8.93% | $45,081.79 |
| Livewire | 2.53% | $12,784.66 |
| Benchmark ASX 200 (STW) |
3.62% | $18,100 |
| Six Park - Aggressive Growth | 3.80% | $19,012.80 |
| Six Park - Balanced | 3.09% | $15,465.90 |
What explains these return?
The best performer across all three portfolios is the fund managers’ pick of Imdex (IMD), up over 23% on the year.
The worst performing stock across all portfolios is the Sharesight clients’ pick of Retail Food Group (RFG), down 36%.
From an attribution standpoint, Imdex represents 60% of the fund managers’ total return, whereas Retail Food Group comprises -45% of the Sharesight portfolio’s return.
The Livewire portfolio is not nearly as volatile. Their best performer has been Ramsay Health Care (RHC), up nearly 7%. Their worst performer is QBE Insurance (QBE) down just -0.65%.
As for our benchmark, Six Park, their leaders are Van Eck Infrastructure ETF (IFRA) up over 11% and Vanguard Emerging Markets (VGE) ETF up over 9%. Both their portfolio lost ground on the SPDR Global REIT ETF (DJRE), down over 5%.
Using the Sharesight Contribution Analysis Report lets us run an attribution analysis to determine what’s happening at the sector level.
Across all portfolios, the consumer services sector (Event Hospitality and Retail Food Group) has been hammered wiping out $43k across all portfolios.
Technology services (Google, Altium) has been the best performing economic area, delivering over $31k.

Remember the best way to analyse the return characteristics of these portfolios is to request access and run a Performance Report or Contribution Analysis Report.
Portfolio notes
- We’ve “invested” $100,000 in each holding while assuming a brokerage fee for each buy transaction of $9.95.
- All dividends are/will be included in the total performance calculation, and are reinvested. Total performance also factors in currency effects.
- Performance figures are total return (versus annualised) as none of the portfolio positions has been held for longer than one year.
- The benchmark return figure assumes that all $500,000 was invested in the benchmark ETF.
All articles in this series
- 2017 stock picking competition
- 2017 stock picking competition - survey results
- 2017 stock picking competition - February update
- 2017 stock picking competition - April update
- 2017 stock picking competition - July update
- 2017 stock picking competition - October update
- 2017 stock picking competition — final results
FURTHER READING

Sharesight users' top 20 trades – June 2025
Welcome to the June 2025 edition of Sharesight’s monthly trading snapshot, where we look at the top buy and sell trades by Sharesight users in all markets.

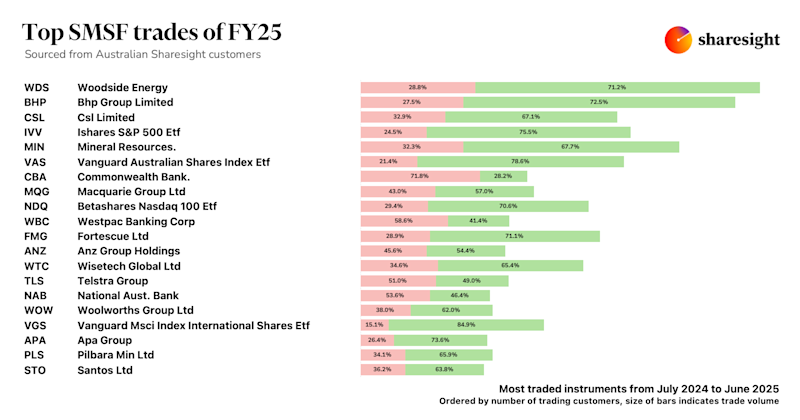
Top SMSF trades by Australian Sharesight users in FY24/25
Welcome to our annual Australian financial year trading snapshot for SMSFs, where we dive into this year’s top trades by Sharesight users.

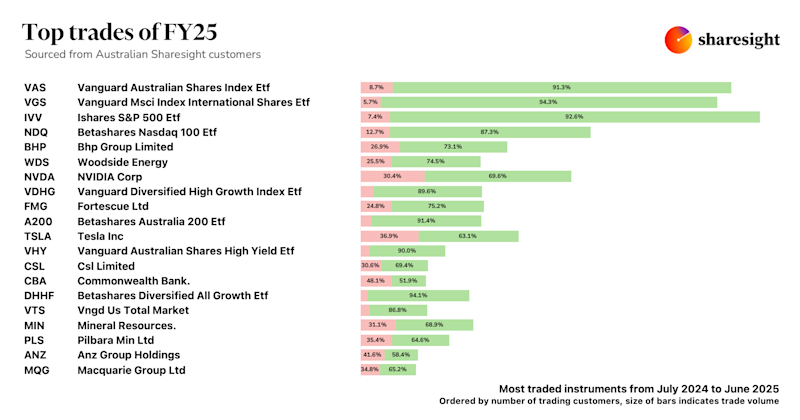
Top trades by Australian Sharesight users in FY24/25
Welcome to the FY24/25 edition of our Australian trading snapshot, where we dive into this financial year’s top trades by Sharesight users.