How your broker’s performance numbers mislead you
As an investor, knowing the true performance of your investment portfolio is crucial. You may ask, "Why do I need Sharesight to track my performance? I already get those numbers from my broker." The truth is, while most brokers provide some form of performance metrics, these metrics are typically reduced to daily price movements and capital gains measured from the stock’s purchase date.
Unlike most brokers, Sharesight gives investors the full picture of their performance by calculating returns on an annualised basis, including the impact of capital gains and losses, dividends, brokerage fees and currency fluctuations. With the ability to track the performance of more than 240,000 stocks, ETFs and funds in over 40 major global markets, Sharesight is the perfect place to track all of your investments in one place.
This post will explain why your broker’s performance numbers are misleading, and how Sharesight provides investors with the true picture of their returns.
Brokers don’t track dividends
In most cases, dividends are the responsibility of the share registries or stock transfer agents, not brokers. This means if you want to keep track of how much you’re earning inclusive of dividend income, you will need to source this information from paper statements, share registry websites or a combination of both.
It is important to keep track of dividend income because it can have a significant impact on your returns. This can be seen from the screenshot below, which shows an LSE stock with dividends contributing to 5.52% of the total return against capital losses of -10.14%, resulting in a net total return of -4.62%.
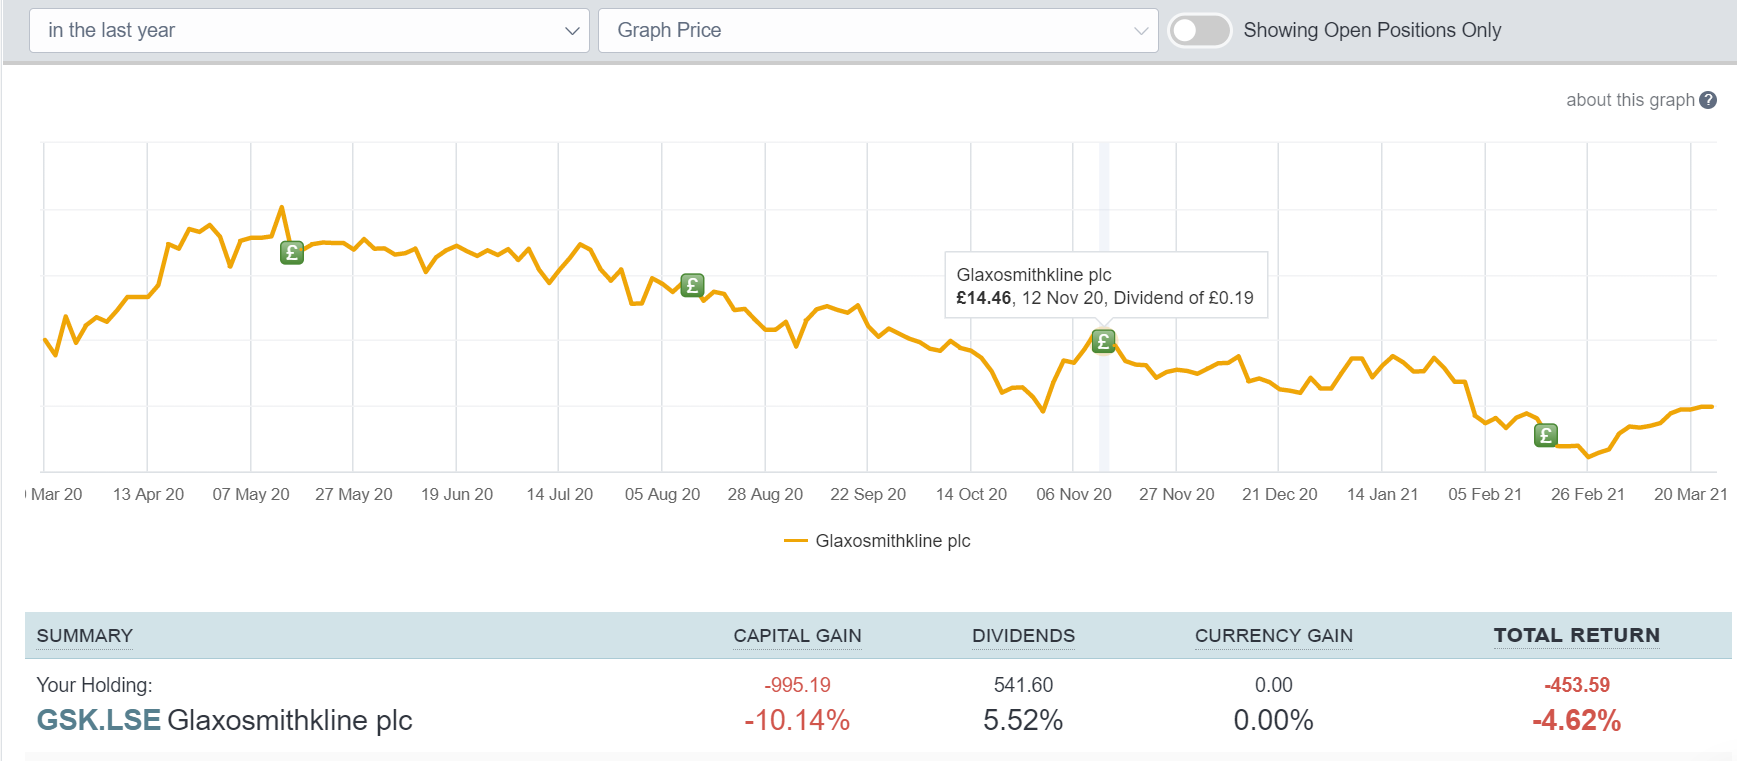 An example of an LSE stock where dividends contribute significantly to returns.
Sharesight automatically tracks dividends, including the option to track dividend reinvestment plans (DRPs) with the Auto Dividend Reinvestment feature, and view upcoming dividends that have been announced with the Future Income Report.
Brokers don’t consider the impact of time
If you look at the performance figures provided by your broker compared to Sharesight, you will notice a key difference: brokers tend to focus on daily price movements and capital gains since the holding’s purchase date, while Sharesight provides you with annualised returns. For example, here is a table representing the performance data given by a typical broker for a small basket of stocks:
| Code | Last price | Net avg. price | Cost | Market value | Day gain | P&L | P&L % |
| CHC | 12.260 | 10.316 | 1,485.56 | 1,765.44 | — | 279.88 | 18.54% |
| CSL | ↓260.120 | 290.931 | 2,036.52 | 1,820.84 | -11.83 | -215.68 | -10.51% |
| NDQ | ↑28.120 | 27.563 | 4,796.00 | 4,892.88 | 13.92 | 96.88 | 2.02% |
| STW | ↓63.750 | 56.208 | 2,979.00 | 3,378.75 | -12.72 | 399.75 | 13.42% |
Performance numbers for a small basket of stocks and ETFs, pulled from a typical broker.
As you can see, the broker puts a lot of emphasis on daily price changes. While this could be useful if you’re just trading on these daily price swings, it’s essentially useless for calculating your investment performance over the long term. Fortunately, some brokers also show you your capital gains or losses to date, as seen above under ‘P&L’. This figure is handy to know, but it is meaningless for comparing the performance of one investment to another.
Here is what the same trades look like in Sharesight:
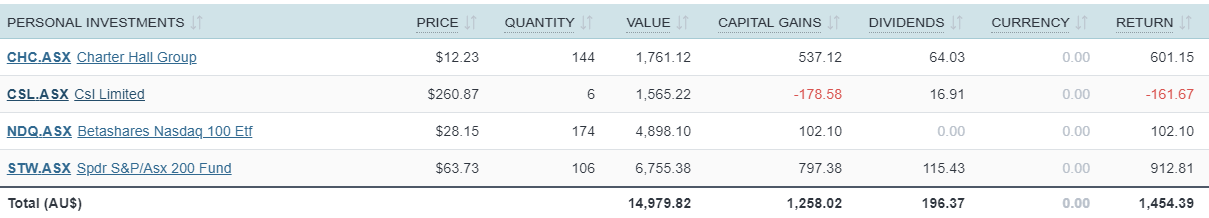 The same stocks in Sharesight, with a slight difference in the price due to Sharesight’s 20 minute delayed live pricing.
With Sharesight, returns are calculated by default on an annualised basis. Why is this important? Let’s look at the example of Charter Hall (ASX: CHC) above. The broker lists capital gains as 18.54% since the stock’s purchase date, which was in 2019. In the past year however, this stock achieved capital gains of 30.4%. This annualised performance figure is meaningful, because it allows an investor to directly compare the performance of this investment to other holdings in their portfolio over the same period, as well as hypothetical investments they could have made instead.
Brokerage fees are ignored
With most brokers relying on brokerage fees and other transaction costs as a source of profit, it makes sense that they don’t call attention to just how much these fees impact your returns. Brokerage fees can certainly add up, especially in proportion to small trade parcels or in large portfolios filled with trades. With Sharesight, you can record your brokerage fees for each trade, with these costs being included when calculating your capital gains.
Currency fluctuations are not factored in
Another important element that most brokers fail to include in their performance numbers is the impact of foreign currency fluctuations. This can have a significant impact on returns for anyone who invests globally, as can be seen in the screenshot example below, which shows a stock holding where foreign currency contributes -24.90% to the total return against 78.51% capital gains and 1.14% dividends, resulting in a net total return of 54.75%.
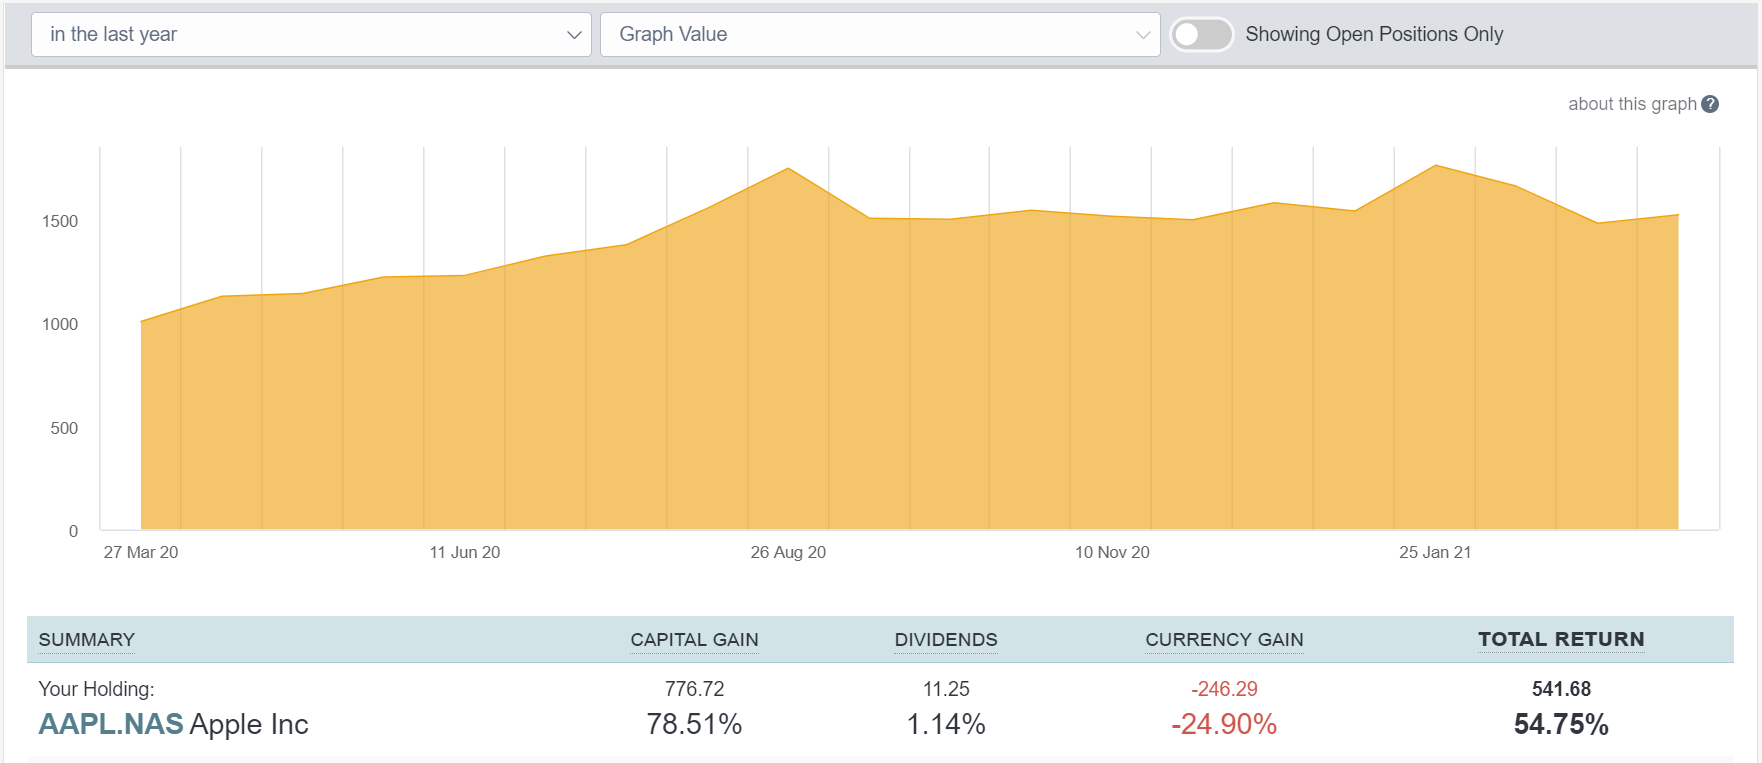 An example of how currency fluctuations impact an investor’s holding of a Nasdaq stock in a non-US portfolio.
With Sharesight, users can track the performance of their investments in over 75 different currencies – including cryptocurrencies – with access to live (20 minute delayed) and end-of-day pricing updates.
What you get from your broker compared to Sharesight
| Most brokers | Sharesight | |
| Performance | Simple return. Doesn't include dividends, brokerage, currency fluctuations | Annualised, money-weighted total return. Incorporates dividends, brokerage, currency fluctuations |
| Performance period | Limited: often only "since yesterday", or “since first purchase” | Any time period |
| Dividends | No | Yes – automatically displays the exact dividends based on how many shares you own (these can be edited), and they are factored into your total return |
| DRPs/DRIPs | No | Yes– and included in total return |
| Foreign exchange impacts | No currency fluctuations as foreign investments often aren’t tracked against your home currency | Yes – converts any foreign investments back to the portfolio’s home currency (on a daily basis) |
| Tax reporting | Limited, if any | Yes |
| Benchmarking | No | Yes |
Why investors choose Sharesight
Embedded content: https://www.youtube.com/watch?v=kdG9RomUJLU
Don’t be misled by your broker, try Sharesight today
If you’re not already using Sharesight, what are you waiting for? Join thousands of self-directed investors like yourself who are using Sharesight to get the full picture of their investment performance. Sign up today so you can:
-
Track the price and performance all of your investments in one place, including stocks, mutual funds, property and even cryptocurrency
-
Automatically track your dividend and distribution income from stocks, ETFs and mutual funds
-
Run powerful reports built for investors, such as Performance, Portfolio Diversity, Contribution Analysis and Future Income (upcoming dividends)
-
Easily share access of your portfolio with family members, your accountant or other financial professionals so they can see the same picture of your investments as you do
Sign up for a free account to get started tracking your investments (and tax) today.
FURTHER READING


Announcing the Sharesight Fintech Scholarship's 2024 winner
We are pleased to announce the 2024 winner of the Sharesight Fintech Scholarship, Temiremi Egwuenu, who is studying Applied Finance at Macquarie University.


Effortlessly track clients’ trades with Sharesight and Desktop Broker
Sharesight has integrated with Desktop Broker, allowing advisers to have their clients’ trading data automatically synced to Sharesight’s portfolio tracker.


Red flags: When should you avoid investing in an asset?
This article explores some of the “red flags” you should look out for when considering an investment for your portfolio.