4 ways Sharesight is better than Google Finance
If you actively manage your own investments, having an accurate, timely and complete picture of your portfolio and the investment opportunities you are watching is vital. Many investors turn to dedicated tools such as Google Finance to help fill this information gap, only to find it falls short for their needs. If you’re looking for a Google Finance alternative to see what’s missing from your financial picture, you need a dedicated investment portfolio tracker like Sharesight.
Here are 4 ways Sharesight is better than Google Finance, and how these key differences can help you become a better investor with the full picture of your investment performance.

Google Finance – built to track stock watchlists
Google Finance’s easy to use watchlist tool is useful for investors seeking new buying opportunities and basic stock research, but when it comes to your performance, daily price movements and percentage gains only tell half the story. To get the full picture of your returns, you need a tool like Sharesight that takes into account key factors such as dividends and foreign exchange rates.
Because Sharesight is designed from the ground up as a full featured portfolio tracker, when you track a watchlist portfolio you can take advantage of a number of advanced features, including the ability to track investment "themes" using Custom Groups, watch the price movements of stocks on international exchanges inclusive of foreign exchange impacts and dividends, and watch the performance of over 170,000 stocks, ETFs and funds from more than 36 global markets going back 20 years.
Track your investment performance
When it comes to actually calculating the performance of your investment portfolio, Google Finance’s watchlist portfolio falls short compared to a dedicated portfolio performance tracker like Sharesight. To understand why Sharesight is a superior solution for investors, let’s take a look at a basket of tech stocks in Google Finance compared to Sharesight.
 Designed solely to track stock watchlists, Google Finance primarily focuses on daily price movements.
The screenshot example above shows what this looks like in Google Finance. As you can see, Google Finance is limited to daily price/percentage gains. If you click into a stock, you will see some additional details of the stock’s price performance over different fixed periods, along with some fundamentals data such as the market cap, dividend yield and P/E ratio.
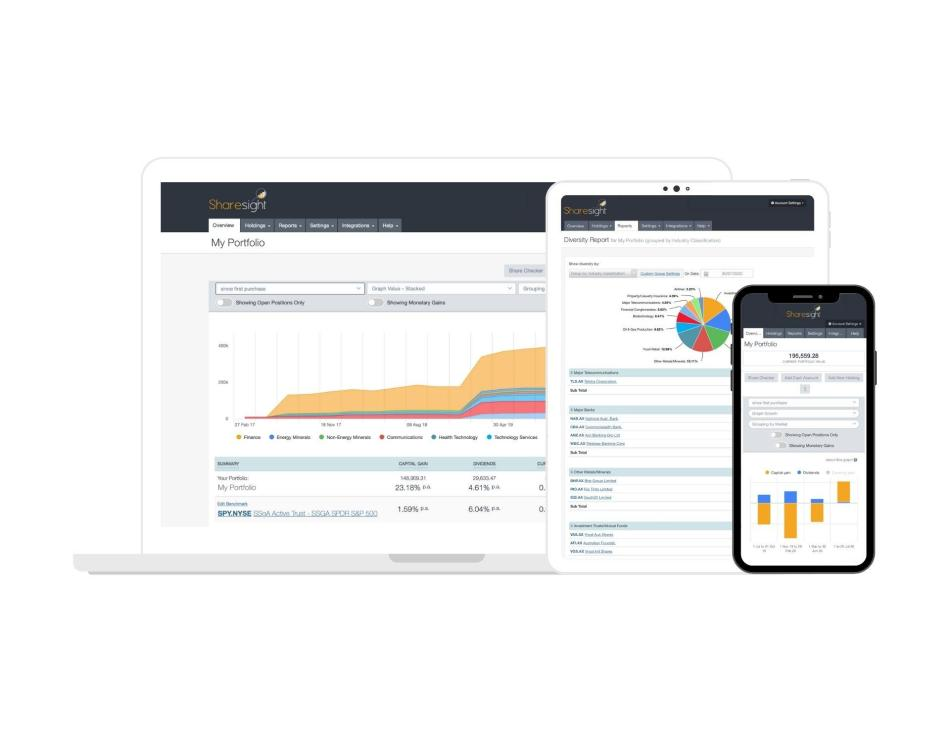
In comparison, Sharesight is a more complete solution, designed for the needs of self-directed investors who need to track investment performance across different asset classes, markets, currencies and brokers. Here is what the same basket of stocks looks like in Sharesight:
 With Sharesight, investors get the full picture of their portfolio’s returns.
As you can see, the difference between Google Finance and Sharesight is that Sharesight is designed to give investors the full picture of their portfolio’s returns, with an annualised performance calculation methodology that includes the impact of capital gains and losses, dividends, brokerage fees and currency fluctuations. This annualised return methodology makes comparing the performance of different investments and timeframes easy, helping investors make decisions on where to invest, with the best information available.
Like Google Finance, Sharesight also provides basic stock fundamentals (for AU/NZ) and stock news (for AU, NZ, US and UK), as can be seen in the screenshot example below.
 By clicking into an individual holding, you can see basic stock fundamentals data and news.
Why you need to be tracking dividends
Another important difference between Sharesight and Google Finance is that Sharesight automatically records dividends and distributions from investments in your portfolio. If you’re measuring a stock’s performance and not calculating the impact of dividend income on your total return, you’re missing half the picture, and a potentially significant source of investment returns. This can be clearly seen in the screenshot example below, which shows a stock where capital gains contribute -14.96% while dividends contribute 5.28%, resulting in a net total return of -9.68%. This highlights the importance of tracking not just capital gains and losses, but also dividends and other key factors that can affect your returns.
 An example showing the importance of dividend tracking when calculating a stock’s performance.
Other useful dividend features include the ability to automatically track dividend reinvestment plans (DRPs) and opt-in to email notifications about upcoming announced dividends, or see all of your upcoming dividend income at a glance with the Future Income Report.
Advanced reporting
For investors with complex investments and varied reporting needs, Sharesight offers a powerful range of reports. Designed for the needs of self-directed investors, these reports give investors the advanced performance and tax insights they need to take control of their financial future and make better, more informed investment decisions.
| Google Finance | Sharesight |
|---|---|
| None | All Trades Report - View your complete trading history |
| Contributions Analysis Report - Great for asset allocation | |
| Diversity Report - Visualise your portfolio diversification | |
| Future Income Report - Predict future dividend or interest payments | |
| Multi-currency Valuation Report - See the value of your holdings in the currency of your choice | |
| Historical Cost Report - View opening & closing balances at cost price | |
| Performance Report - View your performance over any time period | |
| Sold Securities Report - View the performance on shares you’ve sold | |
| Taxable Income Report - See your dividend & interest payments | |
| Capital Gains Tax Report (Australia & Canada) | |
| FIF Report (New Zealand) | |
| Traders Tax Report (New Zealand) | |
| Unrealised CGT Report (Australia) |
Why investors using Google Finance should try Sharesight
While Google Finance offers a simple, easy-to-use stock watchlist and company research tool, Sharesight is the complete package for investors. With automatically updated price and dividend data for over 170,000 stocks, ETFs and funds across more than 36 global markets, Sharesight is built for the needs of global investors who want to track all of their investments (and watchlists) in one place.
If you’re not already using Sharesight, what are you waiting for? Join over 250,000 investors like yourself who are using Sharesight to get the full picture of their investment performance. Sign up today so you can:
-
Track the price and performance all of your investments in one place, including stocks, mutual funds, property and even cryptocurrency
-
Automatically track your dividend and distribution income from stocks, ETFs and mutual funds
-
Run powerful reports built for investors, such as Performance, Portfolio Diversity, Contribution Analysis and Future Income (upcoming dividends)
-
Easily share access of your portfolio with family members, your accountant or other financial professionals so they can see the same picture of your investments as you do
Sign up for a free account to get started tracking your investments (and tax) today.
FURTHER READING


Everything you need for tax time: A guide to Sharesight's Tax Pack
The Sharesight Tax Pack is built to give you everything you need to complete your investment tax, with none of the stress. Keep reading to learn more.


How SMSF trustees can get EOFY-ready
In this article, we discuss the best Sharesight features for SMSFs, and how SMSF members and trustees can get EOFY-ready with Sharesight.


Sharesight product updates – May 2026
This month we launched an AI trade importer, added bulk uploads for cash account transactions, improved the Australian CGT report and expanded fund support.